
Win The Data War: How normal people can survive and thrive in the data abundance era
- Jeff Hulett

- Nov 29, 2023
- 83 min read
Updated: Sep 18, 2025

There is a significant gap between the average person's statistical understanding and the practice of data science. Reflecting this, the tech industry—which employs the majority of data scientists—has adopted a term for its customers borrowed from drug culture: it refers to them as "users." As Sean Parker, former President of Facebook, admitted, “We designed it to be addictive. Social media exploits a vulnerability in human psychology… God only knows what it’s doing to our children’s brains.” This deliberate exploitation of human tendencies positions tech companies as "dealers" or "pushers," delivering digital dopamine hits. They meticulously design the "user interface" and optimize the "user experience" to maximize "user engagement." This strategy parallels that of tobacco companies, which also refer to their customers as "users." While tech companies deliver data through apps and smartphones, tobacco companies rely on cigarettes to deliver nicotine—distinct products, yet remarkably similar dopamine-triggering strategies.
The challenge, however, is that data, unlike nicotine, is unavoidable. Data underpins how our brains process the world and make decisions. Our brains naturally attend to data as a core survival mechanism. Unfortunately, the statistics taught in schools often fail to equip individuals with the tools they need to harness data effectively. This article aims to bridge that gap. By crossing this bridge, you’ll gain decision confidence through practical and intuitive statistical understanding. This confidence is further fortified by tools and insights from data science and business practices. Along the way, you’ll discover resources to help you delve deeper and turn the language of data into your Information Age superpower!
Having been on the dealer's side, I now aim to empower users to take control—equipping them with data and the confidence to make informed decisions.
We will explore gaining knowledge from data by harnessing the power of statistics. Statistics is the language of data. A statistical language starting point is provided by building upon the time-tested statistical moments framework. It shows why learning the world through the data lens is helpful and increasingly necessary.
Just like grammar rules for language, statistical moments are essential for understanding our data-informed past as a guide for navigating the future. As those statistical grammar rules become routine, you will effectively understand the data defining our world. This understanding grows to be a permanent feature guiding your success. Data, as representing our past reality, contains nuance, exceptions, and uncertainties adding context to that historical understanding. The statistical moments framework helps unlock the power of our data.
We begin by making the case for data and why learning the language of data is important. Tools, called 'personal algorithms,' are introduced to help you transform your data. Then, we will jump into the major statistical moments' building blocks. They serve as the article's table of contents. Intuitively understanding these moments provides the grammar and a path to understanding your past reality. The path includes an approach to identify and manage inevitable uncertainties and potential ignorance. Context-strengthening examples and historical figures are provided from science, personal finance, business, and politics.
The Data Explorer's Journey Map
Introduction: The case for data and the data bridge
Don't Be a Blockhead → 0th moment: unity
Our Central Attraction → 1st moment: the expected value
Diversity by Degree → 2nd moment: the variance
The Pull of the Outliers → 3rd moment: the skewness
The Tale of Tails → 4th moment: the kurtosis
Fooling Ourselves → a moment of ignorance
Next Steps → Better Living by Being Bayesian and Practicing Pareto
Conclusion, appendix, and notes
Please follow the links for more formal definitions of the statistical moments. Knowledge of statistics is helpful but not necessary to appreciate this article. For a nice descriptive, probability, and inferential statistics primer, please see this link. Thanks to Liberty Munson, Director of Psychometrics at Microsoft, for providing the excellent primer.
About the author: Jeff Hulett is a career banker, data scientist, behavioral economist, and choice architect. Jeff has held banking and consulting leadership roles at Wells Fargo, Citibank, KPMG, and IBM. Today, Jeff is an executive with the Definitive Companies. He teaches personal finance at James Madison University and leads Personal Finance Reimagined - a personal finance and decision-making organization. Check out his latest book -- Making Choices, Making Money: Your Guide to Making Confident Financial Decisions -- at jeffhulett.com.
1. Introduction: The case for data and the data bridge
Data and algorithms are different.
I offer this disclaimer because data and algorithms are often confused. Data represents our past reality. Algorithms transform data. They are different. Data has already happened. An algorithm is a tool to transform data intended to predict and impact the future. An organization’s data-transforming algorithm may be helpful to you - especially when your attentions are aligned with that algorithm’s objective. More often today, an organization’s data-transforming algorithm is even more helpful for optimizing some other objective -- such as maximizing shareholder profit or filling political party coffers. Please see the appendix for more context.
But algorithms are not just for organizations trying to sell you stuff. You should identify, test, and periodically update an intuitive set of personal algorithms to make a lifetime of good decisions. Personal algorithms are an intuitive set of rules you use to transform your data. Your personal algorithms are either informal or, more necessary today, enhanced with the help of personal decision tools. Together, we will build an intuitive understanding of data in the service of implementing your personal algorithms. Our focus is on using the statistical moments as a bedrock for that data understanding. Our data exploration and personal algorithms will be enhanced by tools and methods, such as Bayesian inference, the Pareto Principle, and choice architecture tools like Definitive Choice. Choice architecture helps implement your personal algorithms.
Choice Architecture and Personal Algorithms.
Behavioral economist and Nobel laureate Richard Thaler said:
“Just as no building lacks an architecture, so no choice lacks a context.”
A core behavioral economics idea is that all environments in which we make a choice have a structure. That structure impacts the decision-maker. There is no "Neutral Choice" environment. People may confuse not making a decision as safer. Not making a decision is no safer, and likely much less safe, than actively making a decision. The choice environment is guided by the subtle incentives of those providing the environment. Those providing the environment almost never have incentives fully aligned with your welfare.
Once you accept this premise, you will see the world differently.
Let's explore a retirement savings example. Many companies provide 401(k)s or similar tax-advantaged retirement plans as a company benefit. As part of the new employee onboarding process, the company provides its choice architecture to guide the employee to make a voluntary retirement selection. Next, we will explore the retirement plan selection process from both the employer's and the employee's perspective.
A company may provide many mutual funds and investment strategies to assist employees in making a retirement plan decision. Their rationale for the volume of choices is partly the recognition that all retirement needs are unique to the individual's situation. The company does not want to influence the employee with a particular retirement strategy. They want to ensure the employee's choice is informed by a wide array of possible alternatives. The well-intended volume of choices should help the employee.
But does it?
But let’s look at it from the employee’s standpoint. This choice environment, with its high volume of complicated-looking alternatives, seems noisy and overwhelming. Even though, the plan administrator likely provides some means of filtering those choices. The overwhelming noise perception occurs because the employee is not accustomed to making retirement plan decisions. The volume of alternatives amplifies the impact on their negative perception. Also, their attention is more focused on being successful in their new job. In fact, research shows, this sort of choice environment discourages the employee from selecting ANY retirement plan. A typical employee narrative may be: "300 choices!? Wow, this looks hard! Plus, I have so much to do to get onboarded and productive in my new company. I will wait until later to make a decision." ... and then - for many - later never comes.
A complicated, overwhelming choice environment causes savings rates to be less than what they otherwise could have been. A compounding factor is that, traditionally, the default choice provided by the employer is for the employee NOT to participate in the retirement program. This means that if the employee does not complete some HR form with a bunch of complicated choices, then they will not save for their own retirement. Behavioral economics research shows this intuitive outcome. When the choice environment is more amenable, people are more likely to choose options benefiting them. [i-a1]
Retirement plans are just one example. This sort of choice environment challenge appears in subscription cancellations, insurance claims, rebate redemptions, and medical billing. In each case, complexity discourages action, increasing profits through consumer inaction. These are low-alignment choices: your gain often comes at the company’s loss, so the choice design is tilted against you.
By contrast, high-alignment choices occur when the company benefits directly from your action. Think of Amazon when you buy a consumer product or Netflix when you stream a movie. In these cases, companies invest heavily in making the choice process smooth, seamless, and even addictive. Their profitability depends on your engagement, so frictions are removed, interfaces are simplified, and nudges encourage more consumption.
Thus, the overwhelming noise perception is captured in the behavioral truisms:
A difficult choice that does not have to be made is often not made.
- and -
Not making a choice is a choice.
Even though, like in the case of a retirement plan with employer matching and tax advantages, making almost ANY choice would be better than making no choice.

Regarding company incentives, the company will usually match employee contributions to the retirement plan. So if the employee does not participate, the company will not need to contribute. An employee not participating reduces the company's retirement expense. Thus, the unused match will drop to the bottom line and be available to the equity owners. A company's default choice environment is a function of its complex incentives and self-interests. As discussed in the appendix, the employee is only one of four beneficial stakeholders vying for the attention of company management. Thus, based on a one in four equally weighted average, management's stakeholder balance will not favor the employee.
Regarding the company’s management relationship with its stakeholders, an unused benefit is like a double win - providing two for the price of one!
Win 1 – The company put the benefit on the table. If an employee chose not to use it, that is on them. We cannot make them save.
Management narrative: Good for the employee.
Win 2 – If the employee does not use the benefit, then the unused benefit drops to the bottom line. Management narrative: Good for the shareholding equity owner.
Retirement planning is one of many choice-challenged examples we face daily. Research suggests that thousands of choices are made daily. [i-a2] The essential point is that modern life is characterized by overwhelming data abundance to influence those choices. As we discuss later, our smartphones and other devices are like data firehoses - spewing data on the user. Whether retirement or many other important choices, the volume and complexity of those choices often discourage normal people from making any choice. The default has become the standard and that standard is set by organizations usually not fully aligned with your welfare.
In the world of corporate marketing and accounting, there’s a term for when the choice environment enables a consumer not to take advantage of an earned benefit. That term is—appropriately—Breakage. A classic example is airline credit cards. These rebate programs are huge money makers not only because of interest charges, but also because customers often fail to redeem the travel benefits they’ve earned. This unused value becomes pure profit for the company.
But Breakage doesn’t happen by chance—it is often the result of intentionally poor choice design.
This brings us to a powerful concept in behavioral economics known as Sludge. Sludge refers to friction that makes it challenging for people to do what’s in their best interest—like redeeming rewards, canceling a subscription, or accessing a benefit. While “nudges” are used to help people make better choices, sludge works in the opposite direction. It manipulates users by exhausting their time, attention, or motivation, often leading to inaction that favors the company.
For example, with airline reward programs, there’s nothing preventing companies from offering a simple cash-back equivalent instead of complex travel restrictions. But the travel reward’s friction—booking limitations, blackout dates, expiration rules—is by design. That’s sludge in action, and its goal is Breakage.
Why This Matters
Sludge and Breakage remind us that the choice architecture created by companies is rarely aligned fully with your best interests. It is built to optimize their metrics, and while consumer outcomes may be part of that objective, they are easily crowded out by the louder demands of other stakeholders competing for management’s attention.
That’s why constructing a choice architecture tailored to your needs is essential. Whether it is setting personal rules for redeeming rewards, automating beneficial behaviors, or using tools that clarify complex decisions, you must take control of your decision environment. In other words, you need a personal algorithm—a system that helps you make confident, consistent, and welfare-enhancing decisions.
Don’t let someone else’s sludge become your lost opportunity.
To explore AI and personal algorithms in the context of making a pet decision, please see:
Data is the foundation.
On the way to implementing or updating your personal algorithms, we must begin by providing a bridge to build your data foundation. Personal algorithms are greatly improved when the beneficiary of those algorithms has a solid understanding of data and statistics. This is the essential data bridge - spanning from the land of choice-challenge to the successful decision-making happy place.
Motivation connects our past data
to our algorithmically influenced future

In my college personal finance class, part of the curriculum is to help students understand the interaction of data, the power of organizational algorithms, and how to leverage or overcome them with a personal algorithm-enhanced decision process.
From data scarcity to data abundance
In the last half of the 20th century, the world shifted from the industrial era to the information era. The changing of eras is very subtle. For those of us who lived through the transition, there was no official notice or “Welcome to the Information Era” celebration. It just slowly happened—like the proverbial boiling frog—as innovation accelerated and our culture adapted. Era changeovers are always backward-looking, often recognized only after the effects have become historically visible.
This shift forces us to rethink how we relate to data, beliefs, and decisions. For most of human history, information was scarce, and our brains evolved to thrive in such conditions. Over just a few decades, scarcity has flipped to abundance. Data is no longer rare; it is relentless. Yet our genome remains wired for data frugality, not flood. Evolution may take millennia to adapt, but we cannot wait. We must train our minds to function in this new landscape, where the mismatch between biology and environment has widened the cognitive gap. The challenge—and opportunity—is to close this gap with better tools and frameworks for decision-making.
In the industrial era, computing power was limited. As a result, math education focused on training people to be the computers. We were the gap fillers for society’s increasing computational demands. Schools prepared students to perform functions that machines could not yet execute. But that has changed—dramatically.
In today's information era, computing power is both ubiquitous and cheap. Moore’s Law exponentially boosted processing speed, but the true unleashing of data abundance came when bandwidth exploded, enabling information to flow effortlessly across people, systems, and geographies. No longer is data trapped in isolated silos. Instead, cloud platforms and APIs make it instantly portable, shareable, and monetizable. The bottleneck is no longer processing power or access—it is attention. In this new economy, attention—not data—is the scarce resource.
In both my college and high school classes, I facilitate an exercise where students share their smartphone screen-time reports. Many reveal usage well over five hours per day. They also admit much of this time is “low investment”—a donation of their attention to the profitability of social media platforms rather than to their own growth.
The same pattern plays out more broadly. Consumers routinely trade personal data and precious attention for convenience or entertainment. This “Dopamine Trade” fuels a symbiosis between artificial and biological intelligence, with companies fine-tuning algorithms designed to capture and redirect our neurobiology.
Data abundance defines the modern information era. Success now depends on identifying your essential data, filtering out the noise, and using computing tools—both machine and cognitive—to make decisions with clarity, confidence, and purpose.

See: A Content Creator Investment Thesis - How Disruption, AI, and Growth Create Opportunity This article provides background for why people are willing to give up their data to the social media platforms.
For most people, today's challenge is no longer about learning to do the work of a computer, as was emphasized during the industrial age. Instead, the challenge is learning how to harness abundant data, apply modern technology, and focus scarce attention toward human-centered, adaptive decision-making. Yet our formal math education systems remain slow to evolve. They continue to emphasize deterministic, rule-based computation rooted in an industrial era when information was scarce and processing power was expensive.
This misalignment is not just a delay—it’s a structural problem. As Upton Sinclair famously noted, "It is difficult to get a man to understand something, when his salary depends on his not understanding it." The same logic applies to organizations. Institutional incentives—like tenure systems, standardized testing, and curriculum mandates—reinforce the status quo. Risk-aversion, bureaucratic inertia, and fear of political controversy further discourage reform. Even well-meaning educators are often constrained by legacy systems that reward compliance over innovation. [i-c]
This is why meaningful change in education rarely comes from within. It comes from outside—from those who see a better way to meet the demands of the information era and act on it. These are parents, technologists, behavioral scientists, entrepreneurs, and lifelong learners who understand that data literacy, statistical thinking, and decision science are the new pillars of economic and personal success.
Sal Khan, founder of Khan Academy and author of The One World Schoolhouse, has shown how millions of students can thrive through personalized, mastery-based learning. As he warns: “Schools today are still organized like factories, with rigid schedules and standardized pacing. But learning should be personal, flexible, and mastery-based. The one-size-fits-all model is obsolete in the information age.”
So, will the traditional education system eventually change? Sure—but only after it's dragged forward by those already building the future. Legacy systems don’t typically transform; they wither as their irrelevance grows. That’s why the responsibility to adapt rests with us. If your formal education didn’t teach you how to think statistically or make structured decisions, now is the time to build those skills yourself. Because the future doesn’t wait—and neither should you.
The big change – From data scarcity to data abundance
Data scarcity was when the most challenging part of a decision was collecting data. The data was difficult to track down. It was like people were data foragers, where they filled a basket with a few pieces of difficult-to-obtain data they needed for a decision. Since there was not much data, it was relatively easy to weigh and decide once the data was located.

Data abundance has changed our relationship with data 180 degrees in just the last few decades. Consider your smartphone. It is like the end of a data firehose. Once the smartphone is opened, potentially millions of pieces of data come spewing out. Plus, it is not just smartphones; data is everywhere. But it is not just the volume of data, it is the motivation of the data-focused firms. The data usage has a purpose... and that purpose is probably not your welfare.
"The best minds of my generation are thinking about how to make people click ads. That sucks." - Jeff Hammerbacher, a former Facebook data leader.

The challenge is no longer foraging for data. Our neurobiology, as tuned by evolution, is still calibrated to the data scarcity world. It is like no one told our brains that how we make decisions is dramatically different today. The challenge is now being clear about which of the overwhelming flood of data is actually needed. The challenge is now to curate data, subtract the unneeded data, and use the best decision process. Unfortunately, the education curriculum often teaches students as if we are still in the data scarcity world.
Economics teaches us that what is scarce is what creates value. So, since data is abundant, what is it that creates value? In the information era, it is scarce human attention creating value for companies trading in data abundance.
For a "Go West, Young Man" decision made during the 1800s as compared to a similar decision today, please see the article:
The big change – From data scarcity to data abundance

The Big Change: Scarcity, as an economic lever, has changed from data to attention.
The Architecture of Belief
Think of belief as a blend of habit’s convenience and fast information processing. A belief acts like a pre-packaged bucket of information—ready to trigger action with little deliberation. Because it is wired for speed, belief lives in the intuitive parts of the brain that favor immediacy over language. This efficiency comes at a cost. Our neurobiological belief system offers weak cognitive signals when it is time to update, leaving many beliefs to persist long after their usefulness has expired. Later, after we build a foundation with statistical moments, we will introduce Bayesian Updating and other decision technologies as tools for strengthening this belief-updating process.
Equally important is where beliefs come from. In childhood, they are handed down by families, cultures, and communities of origin. These inherited anchors are powerful—sometimes constructive, sometimes harmful. Because beliefs operate quickly and often unconsciously, we may carry them into adulthood without scrutiny. Yet all healthy adults must eventually take ownership of their beliefs, questioning inherited ones and updating them as situations demand. For the childhood belief updating framework, please see:
This makes statistics the language of interpreting our past reality in the service of updating those beliefs. Like any other language, the language of statistics has grammar rules. Think of statistical moments as the grammar for interpreting our past realities. The better we understand the grammar rules, the better we can:
Learn from our past reality,
Update our beliefs, and
Make confidence-inspired decisions for our future.
‘Past reality’ may be a nanosecond ago—just long enough for the light of the present to reach your eyes. Or it could be the accumulated experience passed down from distant ancestors encoded in your neural architecture. Either way, our brains are not simply recording devices—they are predictive engines, constantly using past data to anticipate what comes next.
Consider hiking through a nearby wilderness area. The trail is technical—roots, rocks, inclines, and declines make every step a decision. Your brain, trained by evolution, handles this effortlessly. With each footfall, it looks a fraction of a second ahead, evaluates multiple options, and selects the best one to keep you upright and moving forward. Over a few miles, this happens tens of thousands of times. People often think they are tired because of the physical effort—but it’s the cognitive demand, the relentless stream of micro-predictions, burning many of the calories.
Populations, samples, and diversity
Whether making decisions impacting the next moment for your hike or impacting your life direction years from now, this shows why introducing the right data to your brain—and doing so clearly and consistently—is critical for better outcomes. To make sense of the right data, we must first define the categories that organize it—this begins with understanding how populations and their characteristics are statistically described. A group of people is known as a population. Populations are described by distributions, which tell us how often unique traits occur. These patterns help us calculate probabilities, enabling more accurate predictions of future outcomes.
We may share broad similarities as humans, but it’s our unique variations that matter most in decision-making. Understanding those variations—and how they shift over time—is at the heart of statistics. The more effectively you connect your brain to meaningful, structured data, the better your predictions—and your decisions—will become.
Diversity goes beyond typical characteristics, like gender, race, and eye color. Even more impactful is our diverse behavior generated by the uncertainty we face in our lives. Those uncertainty characteristics include:
a) the incomplete and imperfect information impacting most situations,
b) the dynamic, interrelated nature of many situations, and
c) the unseen neurobiological uniqueness we each possess.
This means even the definition of rationality has been redefined. There was once a belief that rationality could be calculated as a single point upon which all people converge. This 'robotic' view of rationality was convenient for mathematics but did not accurately describe human behavior. Instead, today, rationality is more accurately understood through the eyes of the diverse beholder. The same individual is often diverse across different situations because of uncertainty, framing, and anchors. This means the “you” of one situation is often different than the “you” of another situation because of our state of mind at the time the situation is experienced and how seemingly similar situations inevitably differ. Certainly, the different "us" of the same situation and time are also divergent, owing to individual neurodiversity.

This graphic is an excerpt from the article: Becoming Behavioral Economics — How this growing social science is impacting the world
Our hunt is to understand the population's diversity by learning about its past reality and by applying our unique and varying rational perspectives. But rarely can data be gathered on the entire population. More often, we must rely on samples to make an inference about the population. Next, the challenges of reducing the population to a sample are explored.
Tricky samples and cognitive bias
Sample data drawn from others in the population can be difficult to interpret. Because people are so diverse, traditional statistical tests—t-tests, ANOVA, and related comparisons—can sometimes mislead if their assumptions do not fit the real world. This is why understanding statistical moments as the bedrock of these tests is essential. They clarify what the test is really measuring, and where hidden assumptions may be shaping the results. Just as importantly, they remind us that each of us carries unique priors. If those priors are ignored, the inferential quality of statistical tools diminishes.
Complicating matters further, our brains are prone to sampling tricks. Even a single experience—a “sample of one”—can feel representative, triggering representativeness bias. This tendency to overgeneralize easily connects to a deeper, more pervasive bias: confirmation bias. Under situational uncertainty, framing, and anchoring, we selectively notice and elevate samples that appear to validate our prior beliefs, while discounting others. The problem has only grown in the information age, where an abundance of data makes it easier to find a slice of evidence that “proves” what we already believe.
The goal of this article is to build a baseline understanding of statistical moments and then push beyond—applying them in a diverse world where assumptions matter and priors differ. For readers seeking more technical grounding, see our Statistics Primer. Key sections—“Population vs. Sample,” “Hypothesis Testing,” and guidance on t-tests and ANOVA—offer tools to judge whether a sample is representative and whether observed differences are meaningful. Used with care, these methods improve inference from both personal experience and larger datasets.
Next is a typical decision narrative descriptive of the environment leading to confirmation bias and a less-than-accurate decision:

Notice, this is the first time we present the variable X to represent the situation and the variable Y to represent outcomes. The X–Y framework is central to the following statistical moments sections. This narrative is typical of how people experience their decision environment and motivations. The challenge is the past environment influencing a situation, which leads to an outcome, represents only a single observation within the total population. Your sample size of one is likely too small and unique to make a robust inference. To be clear, this does NOT mean your past experience has no decision value... of course it does. Our evolutionary biology is wired such that being inaccurate and alive is better than being accurate and dead. However, blindly following our past experiences as a guide to the future may not include other past realities to help inform our decisions. Thus, except for life and death situations, using the wisdom of the crowd is often better than not.
When a sample size of one is the best decision approach: When my children were young, my wife and I took family trips to Manhattan near Central Park. Our home was in a much less dense Washington DC suburb. So our New York City experience was very different than our suburban customs. We took long walks on the gridded Manhattan streets. Not infrequently, a car would not yield the right-of-way to us walkers. It was scary. We needed to have our heads on a swivel before stepping off the curb.
This annoyed my children. They wanted to know why we had to be so careful because it was the cars that broke the rules. My response was: “It is always better to be wronged and alive than right and dead.”
With the exception of those life-and-death examples, the sample size of many is a more accurate decision approach. Robyn Dawes (1936-2010) was a psychology researcher and professor. He formerly taught and researched at the University of Oregon and Carnegie Mellon University. Dr. Dawes said:
"(One should have) a healthy skepticism about 'learning from experience.' In fact, what we often must do is to learn how to avoid learning from experience."

Properly understanding your past reality in the present decision context is doable with the appropriate decision process. Part of being a good data explorer is using a belief-updating process including a suitable integration of our and others' past reality. A proper decision process helps you avoid confirmation bias and achieve conviction in your decision confidence.

Think of confirmation bias as a mental shortcut gone bad. Most mental shortcuts provide effective or at least neutral heuristic-based signals. [iii] Referring back to that car lesson with my children, my instinct to instruct my children for safety is a helpful and instinctive heuristic. I seek to protect my children without really thinking about it - well, except for that pithy response about the right and the dead. But confirmation bias occurs when a mental shortcut leads us to make a poor decision. As the next graphic illustrates, confirmation bias occurs when only a subset of evidence is used to make a decision. While the current set of information may be convenient and apparently confirms a previous belief, the decision-maker ignores a fuller set of data that may be contrary to the existing belief. This kind of cherry-picking bias leads to a reasoning error called an error of omission. Errors of omission are tricky because, technically, the subset of information is not wrong; it is simply incomplete to draw the appropriate conclusion.

A politician's example for reasoning errors: Fact-checking is often done to detect incorrect statements of the data the politician provides. A false statement is also known as an error of commission. However, the challenge is not necessarily what the politician said, but what the politician did NOT say. Politicians regularly engage in providing incomplete fact sets. Errors of omission are a) different than their error or commission cousins and b) generally tolerated or not detected by the public. Politicians regularly and conveniently leave out data - an error of omission - when trying to sell a particular policy or campaign plank.
Could you imagine a politician saying, “Here are all the reasons why this is a great policy decision! But wait! Here are several other reasons that may make this policy decision risky and potentially not effective. There are many tradeoffs. The chance of success depends greatly on the complex and unknowable future!” We value leaders who govern honestly. There are complex facts and tradeoffs necessary to make a great decision. But a wishy-washy candidate would struggle to get elected. Political theater and a complete rendering of complex policy decisions are very different.
It is not clear whether the politician is selfishly motivated to commit errors of omission, as part of a goal to grow their power base. Alternatively, those errors may be selflessly motivated, recognizing that most people need help clarifying complex situations. It is likely some of both. However, regardless of the politician's motivation, errors of omission are rampant.
Bertrand Russell (1872-1970) - the late, great mathematician and philosopher's timeless aphorism reminds us of the politician's reasoning challenge:
"The whole problem with the world is that fools and fanatics are always so certain of themselves, and wiser people so full of doubts."
For the successful data explorer, recognizing confirmation bias is not enough—we must also understand why it is so difficult to detect. Cognitive biases arise from the emotional parts of the brain lacking language. [iv-a] Aside from a vague feeling, we receive no clear signal when operating under their influence. This makes it easy to misweight emotion-based data; sometimes leaning too heavily on it, other times dismissing it entirely.
Statistics provide the corrective lens. They expand perspective beyond the narrow and potentially biased samples of personal experience. By integrating broader data with our own impressions, we can correct for bias and adopt an outside-in view—one that moves us closer to reality than intuition alone ever could.

Please see the following VidCast for more information on how confirmation bias leads to reasoning errors. This VidCast shows the slippery slope of how confirmation bias may devolve to cancel culture and allow others to determine an individual’s self-worth. Political leaders may aspire to this level of followership. Social Media echo chambers are a hotbed for confirmation bias and cancel culture.
To summarize, the case for being a successful data explorer:
a) data exploration is important in the data abundant / attention scarcity era,
b) data exploration is tricky to manage,
c) data exploration requires a statistical understanding, and
d) data exploration benefits from a robust decision process to appropriately manage.
The majority of the article is an intuitive primer for a core descriptive statistics framework called statistical moments. For those interested in the mathematical foundations behind the concepts discussed, please see our Statistics Primer. The primer is helpful for a deeper understanding but not necessary to gain value from the rest of this article. Following the statistical moments sections is an introduction to applying these moments to your ever-changing and diverse life -- called Being Bayesian and Practicing Pareto.
From Certainty to Wonder: The Incremental Knowledge of Statistical Moments
The method of moments shows how knowledge builds step by step. Each successive moment adds a new layer of insight into a distribution. The paradox is that while the earliest moments provide certainty, the higher moments teach us more about uncertainty—they sharpen our awareness of what we do not fully know.
The 0th moment guarantees certainty at the most basic level: the probabilities of all outcomes sum to one. Something will happen.
The 1st moment adds another kind of certainty: it anchors us with the distribution’s center, its balance point.
From the 2nd moment onward, the knowledge shifts. We move from certainty about “what is” to awareness of “what could be.” Variance reveals risk and dispersion. Skewness introduces asymmetry—outcomes leaning one way or another. Kurtosis exposes fat tails, where rare and extreme events dwell. Each higher moment increases our grasp of shape, but also forces us to admit how much of the world lies in uncertainty.
This paradox—that learning more makes us aware of how much we do not know—is central to both statistics and life.
Mathematician William Byers describes science itself as a continuum. [ii] At one extreme is the science of certainty, where laws and models provide predictable clarity. At the other extreme is the science of wonder, where mystery, uncertainty, and possibility dominate. The statistical moments trace this same continuum. At the left end, the first moments describe a more certain world. As we move rightward, risk, variability, and uncertainty increasingly enter the picture. At the far edge, unknowable fat tails and ignorance give way to wonder.
How statistical moments map to science

0th–1st moments: Certainty — the grammar of probability ensures outcomes exist and defines a center.
2nd moment: Risk — known dispersion around the mean makes outcomes more or less reliable.
3rd–4th moments: Uncertainty — asymmetry and fat tails push us into less predictable/more unknown territory.
Higher moments: Wonder — extreme irregularities and ignorance remind us that models can never capture all possible outcomes.
The remainder of this article explores the statistical moments along this continuum, proceeding from the science of certainty to the science of wonder, and ultimately to the practical task of managing ignorance.
2. Don't Be a Blockhead
0th moment: unity
We now begin our exploration of the statistical moments, starting with the 0th moment. To guide this journey, we use two tools: the Big Block, representing the set of all possible outcomes, and the X–Y framework, where X is the situation carried from the past into the present and Yn the possible outcomes extending into the future. These tools provide a consistent way to interpret each moment, from the baseline of unity to the higher moments that add center, spread, asymmetry, and shape.
The 0th statistical moment represents unity—the fact that the probabilities of all possible outcomes sum to one. It tells us nothing about center, spread, or shape; it simply ensures that something will occur. Like conservation laws in physics, it is the baseline condition: existence without structure. In this sense, unity resembles a state of maximum entropy—where order dissolves into uniformity. Just as black is the absence of light, unity is existence stripped of attributes. It is the inert default, closer to death than to life. This contrast highlights why the higher moments matter—because they describe the information and structure that make life possible.
Unity refers to a block of unknown outcomes: our life has situations lacking certainty but able to be understood with probabilities. These probabilities describe potential differing decision path outcomes, like—“If I do X, then Y different outcomes could occur. Each outcome path Yn carries its own unique ‘will it happen’ probability.” Because we have imperfect information and the world is dynamic, the X situation has a set of Y outcomes, including some unknown outcomes. Unity means that, while we may not be able to anticipate a situation’s outcome, something WILL happen. In the unity state alone, we are unable to differentiate the set of potential outcome paths. They are mushed together like a big blob. Differentiating potential outcomes will come in the later statistical moments.
Keep in mind that any given situation, X, often involves many attributes. Formally, we could represent this as Xn, with n signaling the multiple factors shaping a situation—ranging from the influence of others to our own genome and earlier environment. For simplicity, we will roll these attributes into a single representation, X, the situation itself. This X–Y framework and the “Big Block” will be used throughout the statistical moments discussion.
Think of X as the input situation carried from the past into the present, and Yn as the possible outcomes carried from the present into the future. In our framework, we collapse the multiple attributes of X into a single fixed state—the current situation you face. This reflects the idea that your past has already occurred and, for our purposes, is assumed fixed. Like sunk costs in economics, nothing can change it, even if some details remain unknown to you. What matters is that you retain full agency in the present to shape future outcomes. The choices you make today can still influence which of the multiple Yn paths becomes reality.
Uncertainty enters in two forms. Epistemic uncertainty arises from gaps in knowledge about the current situation X: information may exist, but is not known to you at the time of decision. Aleatory uncertainty arises from the inherent randomness of future outcomes Yn, which cannot be eliminated even with perfect information. In other words, the past is fixed, but our understanding of it may be incomplete (epistemic), and the future is inherently variable (aleatory).
An analogy may help. Imagine you are playing cards. The hand you hold is your X. The cards are fixed—you cannot change them—but if you have not looked carefully, epistemic uncertainty clouds your knowledge of what you already hold. Once you play, the draw and the responses of other players introduce aleatory uncertainty—random outcomes beyond your control. In this way, X is shaped by past constraints, while Yn reflects the variability of what comes next. Keeping this X–Y framework in mind will help clarify how statistical moments describe both what we know and what remains unpredictable.
Earlier in my career, I had a wise boss named Bill Minor. Bill ran a Mortgage and Home Equity operation for a Wells Fargo legacy bank. Bill was famous for saying:
"Not making a decision is a decision."
While Bill may not have been aware of it, he was describing unity. His saying means that regardless of whether or not we make an explicit decision, an outcome is inevitable. In his own special way, my former boss was encouraging me not to be a blockhead.

When the situations of our lives blur into a single block of unknown outcomes, we lose clarity. This low-fidelity view is the ultimate “forest versus trees” challenge. Unity sits at such a high level that all potential outcomes—the individual trees—collapse into one indistinct forest. In that state, the present may feel overwhelming because the paths forward are hidden, even though multiple outcomes remain possible.
Unity, like the other moments, has a basis in physics. Unity corresponds to maximum entropy, void of the diverse structures necessary to support life. Higher entropy is associated with random disorder which, in a human being, pertains to death. Lower entropy is associated with the order needed to support life’s rich diversity.
It may seem strange that order supports diversity. It is our highly ordered cells, neurons, DNA, and related building blocks making up our skeleton, organs, muscles, and other human structures. It is those highly ordered building blocks allowing our human structure to be so different. Think of them like Legos. Each Lego may be simple and uniform, but in massive numbers, they enable an astonishing diversity of structures. Our Lego architect is natural selection, working on the blueprint of the genome shaped by the environment. Without that ordered foundation, we would all just be part of the same undifferentiated primordial soup.
Religions and philosophies have long tied this high-entropy unity to both the beginning and the end of life. The Bible describes humans as returning to dust—a uniform, entropic state—after death: Dust is the uniform, high entropy default state from which lower entropy life arises and ultimately returns: "By the sweat of your brow you will eat your food until you return to the ground, since from it you were taken; for dust you are and to dust you will return." - Genesis 3:19
Stoic philosophers echoed this truth. As Seneca wrote: “‘does death so often test me? Let it do so; I myself have for a long time tested death.’ ‘When?’ you ask. Before I was born.” - Seneca, Epistles 54.4-5
Appreciating unity is easier when contrasted with diversity. Darwin helped the world understand how diversity in life is sustained by natural selection and genetic mutation. Mutations introduce variation, while natural selection favors the traits that improve survival and reproduction. Over generations, this process drives the complexity and richness of life.
Going beyond moment 0: Why is diversity important? Just as diversity in biology sustains life, diversity in human activity sustains prosperity. If all people were the same, there would be no gains from trade. As Russ Roberts put it: “Self-sufficiency is the road to poverty.” David Ricardo’s theory of comparative advantage reinforces this—showing that even if one person or nation is better at everything, mutual gains arise when each specializes in what they do best. Our diversity makes markets work, and money is how we vote for the specialties that best reduce our entropy. [iv-b]
Given human life expectancy has more than doubled in the last 200+ years and global economic output (GDP) has increased 50x during that time, our entropy-reducing prosperity has rocketed ahead because of diversity-enabled market economics and the benefits of trade.
The 0th moment reminds us that unity alone is inert—existence without attributes, high entropy without structure. It is the foundation of probability but not yet the source of meaning. Only by moving into the higher moments do we begin to separate the forest into trees, the blob into structured outcomes, and existence into life. Unity is the block. The higher moments carve that block into the patterns that sustain diversity, choice, and prosperity.
To explore the impact of entropy across our lives, including the sources for the growth in global economic output and life expectancy, please see the article:

To conclude the unity section, the next graphic shows the resolution for the Big Block. People have an amazing potential to see through the Big Block as a structured set of possible outcomes. By applying the lens of statistical moments, we gain more than just an understanding of life’s knowns (Y1)—we also learn to quantify risk (Y2), manage uncertainty (Y3), and guard against the blind spots of ignorance (Y4). The language of data and its grammar rules empower you to interpret your likely outcome paths with greater clarity and confidence. This deeper understanding helps you make better decisions and get the most out of your life.

Building on our discussion of epistemic and aleatory uncertainty, we now introduce the HRU framework as a way to organize data into a useful structure—distinguishing between what we know and what we do not know, both today and in the future. This framing helps reveal how the statistical moments provide clarity for decision-making in environments that are less than certain.
The next graphic describes the Big Block’s four Y outcome types. These four paths are laid out along two time-based dimensions: (1) the situation—what we know today—which aligns with the X plane in the Big Block, and (2) the outcome—what the uncertain future holds—which corresponds to the Yn outcome paths. This aligns with standard statistical notation, where X represents independent variables (inputs or conditions), and Yn represents dependent variables (future outcomes).
The HRU framework serves as the interpretive key to the Big Block, mapping each Y-path to one of four outcome types: Y1 – Known, Y2 – Risk, Y3 – Unknown, and Y4 – Ignorance. It builds on those same X and Y dimensions to help decision-makers categorize situations and anticipate uncertainty. These outcome types correspond with the statistical moments that follow—each moment offering a lens to interpret different distributions and behavioral patterns. The HRU framework does more than label uncertainty—it enables confident, structured decisions through intentional information curation and belief updating.

For more information on how to manage certainty and uncertainty in our many life situations, please see the HRU framework. The HRU framework is described in the article:
The remaining statistical moments will refer back to "The Big Block" and the four Y outcome types:
Y1: Known → 1st moment, Expected Value
Y2: Risk → 2nd moment, Variance
Y3: Unknown → 3rd moment, Skewness and 4th moment, Kurtosis
Y4: Ignorance
3. Our Central Attraction
1st moment: the expected value
Next, the first moment measures how a diverse distribution converges toward a central point. This is the simplest description of a diverse population. This is where a known single, solid white path (Y1) is drawn through the big block. As will be shown in the following Galton Board example, gravity is the great attractor toward the center. There are 3 different central point measures, known as the average. The different average measures are the 'central tendency' descriptors of a distribution - that is - the mean, median, and mode. Each average measure is a little different and their difference gives us clues to consider when applying the remaining moments.
Y1 Known Path

In a normal distribution, the mean, median, and mode align. The degree to which they diverge offers an early signal of non-normality, often pointing to skew. Yet this signal alone is incomplete. It is like checking only the average score on a class test while ignoring how widely scores are spread or whether a few extreme results distorted the picture. To truly understand the shape of a distribution, we need the fuller grammar of the other statistical moments -- variance, skewness, and kurtosis.
The normal distribution is a natural standard often used as a comparative baseline between distributions. This standard originates from the physics of calm, natural environments with independently moving molecules and atoms. Normality is that calm, constant-gravity state before excess energy is added to a system. That normal-impacting energy may certainly result from human intervention. Since humans intervene with many systems, we can expect the three average measures to differ.
Is the normal distribution a misnomer? The word 'normal' in "normal distribution" may seem like a misnomer. Since normal distributions are the exception in human affairs, not the rule, perhaps a better name would be the "abnormal distribution" or the "unusually calm distribution."
When considering a distribution, its central tendency measures should be compared to (a) the benchmark of normality, (b) each other, and (c) the context of that distribution’s past reality. This past reality functions much like priors in Bayesian inference, serving as a starting point for interpreting new evidence—a theme we will return to later in the article. These 3 comparisons give us clues to interpreting data the way an artist paints a picture. The tools for an artist are paint and a paintbrush. However, for our intrepid statistical moments language interpreter, their tools are data and statistics. These clues are only a starting point. The clues suggest a line of inquiry involving the other statistical moments.
The data interpreter to artist comparison. The next picture shows a window looking out to a mountainous landscape. That landscape is filtered by a black screen covered with data. That data describes the landscape. It is the statistics that help our data interpreter understand that landscape through the data.
Similarly, let’s say our data interpreter was also an artist. They would use paint that represents the colors and textures of what they see in that mountainous landscape. Our data interpreter turned artist will then use the paintbrush to apply that paint to the canvas as their understanding of that landscape.
In this way, data and statistics are just another way for us to interpret our world… like the way an artist interprets the world through their painting.

An example of using the central tendency measurements: Please consider the retirement age of the American population. The retirement population tends to bunch around the mid-60s years of age and then have a long tail toward the end of life - in the mid-80s or beyond. This means most people retire in their 60s, but some wait longer or work to the end of their life. The U.S. Government provides incentives—such as Social Security—that enable retirement in one’s mid-60s. These incentives function as behavioral attractors, nudging large populations toward a common outcome. In physics and dynamical systems theory, an attractor is a state or set of conditions toward which a system naturally evolves. Chaos theory extends this concept to complex systems, where even unpredictable behaviors are drawn toward underlying patterns or paths. We will explore how such attractors influence statistical distributions and decision dynamics in later sections. But not everybody can or wants to retire in their 60s. As a result, the mean age will be higher than the median age. This makes sense in the American cultural context. Think of the American retirement culture as a human intervention causing the central tendency measures to differ. But what if we saw a retirement distribution where the mean and median were much closer together than in the typical American retirement context? What should be concluded? Relevant questions are:
Is this an American population or perhaps a different culture that does not intervene by relating retirement to not working? In many cultures outside the United States - they either do not have a word for retirement, their definition of retirement relates to change or growth, or retirement means support for people as they age and in their ability to be productive throughout their life. [v]
Perhaps there is a measurement error. Maybe American retirement activities are being improperly recorded as work in the data. Also, the opposite could be true for that initial data set showing the mean-median skew. Perhaps Americans are working after retirement age but their activities are not captured as work. For example, if someone volunteers at a children's hospital, should that activity be considered work? Just because someone does not get paid does not mean that activity does not either a) create economic value on par with paid activities or b) provide "payment" in non monetary form, like feeling good about helping children.
If it is an American population, are there context clues as to why the population's central tendency measures are not as expected? Perhaps this is a more agricultural community where retirement age and practices are more tuned to the natural rhythms of the farm. Thus, because there is little government impact, the people's attitudes toward retirement are less dependent on a central government policy and more attuned to life's rhythms.
What is the definition of retirement? Are the 2 datasets using the same definition?
What can the other statistical moments tell us about this population? The other statistical moments will be explored later.
Thus, retirement programs are a social intervention causing less normal distributions. Less normal distributions can be interpreted by using the remaining statistical moments. But first, the normal distribution as a natural standard will be explored with a wonderful simulation. Unlike the retirement distribution, this is where the 3 central tendency measures are the same.
A population simulation - the normal distribution as a natural standard. The Galton Board was invented by Sir Francis Galton (1822-1911) [vi]. It demonstrates how a normal distribution arises from the combination of a large number of random events. Imagine a vertical board with pegs. A ball is dropped on the top peg. There is a 50% chance, based on gravity, that the ball will fall to the right or the left of the peg. The '50% left or right' probability occurs on every peg contacted by the ball as it falls through the board. Think of each peg as representing a simple situation where there are only 2 possible outcomes within the block, left or right. Gravity is the operative natural phenomenon being captured by the Galton Board's design. After many balls are dropped, the result is a normal distribution. More balls are found central than on the outliers of the distribution.
This shows what happens when elements of nature, like atoms or molecules, act independently in a calm, natural system. The outcome often resembles a normal distribution. In the Galton Board, the 'elements of nature' are represented by the balls. The 'natural system' is represented by gravity and the pegs.
Feel free to play with the Galton Board simulation next. Below the box, please activate the "high speed" and "histogram" boxes. Then activate the single arrow to the far left to initiate the simulation. Watch as the Galton Board works its magic. The result is a normal distribution!
Thanks to Wolfgang Christian for this wonderful digital rendering of The Galton Board.
Unlike unity and the dark, undifferentiated big block, we have now added light by drawing a single path through the big block. The average is like the view of a forest as a single entity or path - even though - we know that it is the diversity of trees found in the forest that makes the forest interesting. Perhaps, the fact that the forest's color is usually green or the path through time changes color with the seasons - the average - is interesting to some. The forest’s average does help us understand its dominant attractor. The forest's dominant attractor, as with most natural systems, is gravity. But it has other environmental attractors, like temperature, sunlight availability, wind, and soil quality. For example, the degree to which there was past volcanic activity will greatly impact the quality of the soil available to the forest’s inhabitants.
However, it is the trees within the forest that possess a diverse array of characteristics—such as colors, leaf shapes, height, width, and the spectrum between evergreen and deciduous foliage—that are even more interesting. Each species and individual plant develops a nuanced relationship with its environment. Charles Darwin, natural selection, genetic mutation, and epigenetics help us understand the great adaptability and resulting diversity of life. While genetic mutations alter DNA sequences over generations, epigenetics refers to changes in gene expression triggered by environmental factors—without altering the underlying DNA. These epigenetic mechanisms allow organisms to adapt more rapidly to their surroundings, complementing the slower process of natural selection.
Next, we begin our exploration of the diverse trees found in the forest.
4. Diversity by Degree
2nd moment: the variance
The second moment helps us understand the distribution’s diversity. The second moment describes the variance of that distribution. That is, how the observations of a distribution differ from its mean. A high variance indicates the population is more diverse than a low variance. In our big block, multiple paths may be drawn through the big block. (Y2) These are the white, dotted risk lines representing probabilistic outcomes. In our forest and trees example, this is where the tree species vary in predictable ways from the forest average.
Y2 Risk Paths

Also, the variance of the population may lead to insights about more uniform subsegments within that population. Returning to our forest and trees metaphor—a high characteristic variance in the overall forest population may prompt us to segment by species. Analyzing individual species often reveals lower within-species variance compared to the total forest. The variance of each sub-population (e.g., oak, maple, cedar) contributes to the overall forest variance, weighted by the relative frequency of each species. These sub-populations also allow us to infer the probabilities and entropy associated with each species—how predictable or uncertain each tree type is relative to the broader forest. A highly variable forest will include very different outcomes. Some species are fragile and less likely to survive, while others are more resilient. This relates to low and high entropy. However, the forest's resilience is generally strengthened with species diversity. While environmental changes may kill off a particular species, diversity makes the forest more resilient to withstand many environmental changes.
This same logic applies to stock and fund investing. The volatility (i.e., variance) of individual stocks within a mutual fund aggregates to determine the fund’s total variance. However, diversification across different stocks reduces the fund’s overall entropy—the level of unpredictability in performance—compared to its most volatile components. Just as a forest composed of many distinct but internally stable species has lower entropy than one dominated by a chaotic mix, a mutual fund’s structure lowers the risk of extreme, unpredictable outcomes. An individual company can experience collapse or meteoric growth, but a well-designed fund absorbs these events, producing a lower-entropy, lower-variance system that provides both upside returns and downside failure protection.
In the same way tree species help you understand the composition and resilience of a forest, fund types help you understand the makeup of investment strategies. A high-growth domestic equity fund is like one fast-growing, sun-seeking tree species, while a stable, dividend-producing utility fund is like another slower-growing, shade-tolerant species. Each contributes differently to the overall ecosystem, and understanding these "species" of funds allows you to build a more robust and adaptable investment forest.
That is why diversification is so important!
In the earlier Galton Board example, a normal distribution was demonstrated with a mean, median, and mode of 0. There were an almost equal number of observations above 0 as below 0. However, while many balls landed closer to 0, not all did. In fact, a small number of them fell relatively far from the 0 central point. This variance from the central point occurred because gravity attracted the balls, but there was still a 50% chance the ball would fall away from the center at each peg. As the ball fell away from the center of multiple pegs, the distance from the central point increased. For example, with 10 levels in the board, the probability of a ball falling to the furthest point on either side—by consistently going the same direction—is (0.5)^10, or just 0.098%, less than one in a thousand. While rare, such extreme outcomes are still possible. We will explore the importance of these low-probability, high-impact tail cases further in the Moment 4: Kurtosis section.
Francis Galton’s work was informed by Adolphe Quetelet (1796-1874). He was one of the founders of using statistics in social science and developed what he called “social physics.” Quetelet's social physics was an attempt to quantify the social sciences in the same way that Newton had quantified physics. Quetelet noticed that social statistics, like crime, stature, weight, etc., fit a normal distribution. Quetelet’s work was pure, in that his social observations were generally independent and occurring in relatively unaffected social environments of his day. This was at a time when there were few social programs or interventions causing a less than normal outcome like in the prior retirement example. In this way, the pure environment was more like how gravity impacts atoms and molecules.
However, often gravity is not the only attractor. As we will explore throughout, human affairs - by definition - will have other attractors. Quetelet's and Galton's work is useful as a gravity-initiated baseline, but in today's complex and policy-impacted world, their work is often insufficient to fully understand most situations alone via the data. The degree to which other attractors impact our past reality is the degree to which our past reality differs from the normal distribution expected value and variance.
Another representation of a variance is a standard deviation. The square root transforms the variance into an easier-to-compare standard deviation. In a normal distribution, about 2/3rds (68%) of the distribution can be found one standard deviation above or below the mean. As such, if 1,000 balls were dropped through the Galton Board, approximately 680 would land within one standard deviation of the mean (centered around 0). That means about 320 balls would fall outside this range, with roughly 160 landing to the left and 160 to the right of one standard deviation.
For some, this may be the only moment to help them understand the world’s diversity. This is unfortunate. The variance alone only suggests a high-level degree of diversity. However, variance does not help describe the essential manner of a population's diversity. That is, the "why" behind the degree to which a variance is higher or lower. In fact, with variance alone, one could conclude the manner of diversity is consistent and well-behaved. As we will discuss next, many systems do not lend themselves to this simplified conclusion.
Well-behaved systems are better described by variance: Sometimes, natural systems are reasonably well-behaved. Think of convection currents available in day-to-day life - such as stirring cream in coffee without a stirrer or defrosting dinner on the kitchen counter. These natural and calm systems are well-behaved. The variance of cream molecules or heat electrons does behave in standard or "normal" ways. Of course, if you stir your coffee with a spoon or microwave your frozen dinner - a human intervention - the excited electrons and molecules will act in less-than-normal ways.

Not well-behaved systems are fooled by variance: Variance, as a descriptive statistic, can be calculated for any sample. The difficulty lies in comparison. Variance observed in calm, stable environments of the past cannot be meaningfully compared to variance in today’s chaotic markets.
Human systems are rarely well-behaved, and variance often misleads. Consider a stock market jolted by a news event. Trading volume surges, energy enters the system, and price distributions deviate sharply from normality. In shorter timeframes especially, stock prices display extreme volatility and directional persistence. Variance from calmer times, because it captures magnitude but not the character of diversity, can therefore give a deceptive picture of risk.

Many are prone to stopping their past reality investigation at the second moment. Unfortunately, doing so forces us to make inappropriate simplifying assumptions about an extraordinarily complex world. Understanding dynamic stock market systems, like other dynamic systems, require deeper statistical moment investigation than stable coffee stirring systems. In today's world, well-intended social policy creates new attractors diverging from gravity or the well-behaved "pure" environment. It is the third and fourth moment that opens the door to a world teeming with uncertainty and complexity. This is our Y3 path from the big block.
For an example of managing volatility in the context of building personal wealth, please see the article:
5. The Pull of the Outliers
3rd moment: the skewness
The third moment is called skewness. It mathematically quantifies inertia by measuring the asymmetry of a distribution, capturing how extreme values (outliers) influence the central tendency and create resistance to change. For example, in a positively skewed distribution, the long tail of higher values creates a directional pull that shifts the mean upward, reflecting inertia against reverting to symmetry. This property makes skewness a valuable tool for analyzing the dynamics of diverse systems where extreme values drive collective behavior.
A helpful, minimally skewed baseline example is the Galton Board—a device where balls fall independently through a series of pegs and form a bell curve. This represents a stable, natural system. Because the only attractor is gravity, and the balls act independently, the resulting distribution is symmetric with no skewness or inertia.
Now imagine a fictional twist: each ball is lightly magnetized. If one ball drifts to the left, it slightly increases the chance that the next ball will be pulled in the same direction. We have moved from a single attractor (gravity) to two attractors (gravity plus light magnetization). Over time, this interdependence introduces skewness into the distribution.
While inanimate objects rarely interact this way, people almost always do. We are social creatures, and our choices influence one another. In domains like stock investing, this magnetic pull shows up as herding behavior, where social influence drives outcomes away from symmetry and toward asymmetry.
In the normal distribution introduced earlier, independence ensures no inertia. Each observation is uninfluenced by the others, so no cumulative momentum or directional bias arises. But inertia is a regular feature of the diverse, interdependent distributions found in human affairs. Skewness captures how momentum among observations creates inertia, pulling systems away from equilibrium and symmetry.
By the way, momentum and inertia are related but serve distinct roles in both physics and human behavior. Momentum is the tendency of a body in motion to stay in motion, influenced by both speed and direction. In statistics, and particularly in the context of skewness, momentum reflects how outliers or extreme values introduce directional pressure—pushing the center of the distribution away from the mean. In financial markets, for example, momentum from repeated behaviors like herding amplifies trends, creating skewed outcomes and widening dispersion.
Inertia, by contrast, is the resistance to any change in state, whether that means starting, stopping, or altering direction. In human behavior, inertia shows up as the reluctance to shift habits or beliefs—even when new evidence or direction is warranted.
In human affairs, individuals have different kinds of attractors. In our day-to-day lives, it is the legal environment, culture, and our social connections creating a behavioral momentum that guides us toward varying outcomes. The social attractor is a powerful alternative attractor that may inappropriately influence our decisions. It does not mean those outcomes are guaranteed, but those environmental forces relentlessly shape our trajectories. This is like the inevitability conjured by the aphorism: "Water finds its own level."
In terms of the important decisions of our lives:
a) people are strong social creatures and tend to herd together when making decisions, and
b) most significant decisions have uncertainty.
The power of our social nature should not be underestimated as an inertia-generating force. Sociologist Brooke Harrington said that if there was an E=MC^2 [energy equals mass times the square of the speed of light, Einstein's Equation] of Social Science, it would be that the fear of social death is greater than the fear of physical death. [vii]
This means if your social reputation is on the line (a) and you have financial decisions laced with uncertainty (b), you are more likely to follow social cues – even if those social cues lead to a worse outcome for you. An example of the “social death > physical death” fear phenomenon is our nature to sell investments into falling stock markets. This behavior contributes to measurable skewness in stock market data by creating asymmetry in price movements. When large groups of investors sell in response to falling markets, they amplify downward momentum, shifting the distribution of returns and causing a longer tail on the negative side. This herding behavior reinforces the skewness, making market recovery slower and more challenging. Even though, financial theory and centuries of experience tell us buying diversified investments in falling markets is the best approach to maximizing wealth.
So, the gap created by an individual's uncertainty is often filled by our social nature to follow others. As a result, an individual's observations can attract followers. Herding behavior generates momentum—a self-reinforcing directional trend in decisions or asset prices. Over time, momentum builds into inertia, as people continue in the same behavioral pattern, resisting the effort required to re-evaluate or change course.
Skewness does not measure inertia or momentum directly, but it reflects their impact on a distribution. For example, stock prices often exhibit skewness when momentum drives excessive buying or selling. In recessionary environments, negative momentum builds as prices fall and people follow others by selling—reinforcing the downward trend.
If people were “normal”—meaning we acted like the independent, random balls on a Galton Board—then inertia would not persist, and prices would fluctuate symmetrically around a stable mean. But people are not normal! At least, not from a statistical standpoint.
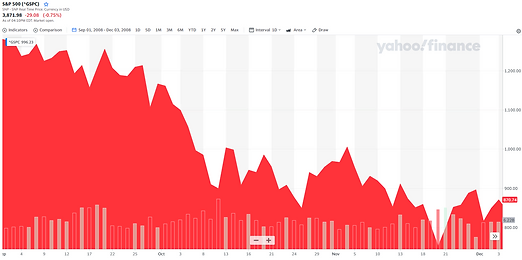
The chart below illustrates this dynamic during the 2008 Financial Crisis, where herding behavior amplified negative momentum. Rather than stabilizing, prices continued to fall—showing how inertia can drive markets far from equilibrium.
The S&P 500 from September 1 to December 1, 2008. This demonstrates an almost 40% drop during the "dark days" of the Financial Crisis.
Financial experts know that inertia can be destructive to an individual’s wealth. Objectively, a wealth-generating habit is to "buy low and sell high." However, our nature often pushes us to "buy high and sell low," especially in chaotic, sell-off markets where fear and herding behaviors dominate. This wealth-preventing perversion is part and parcel of social inertia reflected in the skewness of the 3rd moment. While skewness does not directly measure inertia, it captures the asymmetry in outcomes that such persistent behaviors produce.
These inertial patterns persist because our emotional instincts—especially fear and loss aversion—often overrule objective analysis. Arguably, the single most important contribution of behavioral economists is the commitment device. This tool helps individuals override their human tendencies when momentum-driven skewness leads to inertia and poor financial decisions. For example, an automatic investment plan that continues to invest even during market downturns is a commitment device in action. It enables dollar cost averaging—a proven strategy—by removing the emotional resistance people face when manually deciding to invest in a falling market. Commitment device to the rescue!
In expanding economic environments, the opposite occurs. Stock prices tend to gain upward momentum as people follow the persistent buying of others with buying of their own. Over time, this behavior becomes entrenched—a form of inertia—where individuals continue to buy simply because others are buying, not because of underlying fundamentals.
The chart below shows the S&P 500’s performance over the decade following the 2008 crisis—nearly a fourfold gain. Investors who summoned the courage to stick with their plan and resist panic during the market’s free fall were rewarded with massive long-term gains. This sustained rise reflects how positive momentum, reinforced by herding behavior, can drive markets upward. Inertia takes hold as investors keep buying, often powered more by crowd psychology than by fundamentals.
The S&P 500 for the decade beginning September 2008. This demonstrates an almost 4x gain including and after the Financial Crisis.

Please see the next link to explore the mathematical intuition of the time value of money and why overcoming inertia is critical to long-term wealth.
Please follow the next link for an example of a commitment device in action. The commitment device is explored in section 3, "Pay Yourself First."
6. The Tale of Tails
4th moment: the kurtosis
The fourth moment is called kurtosis. Before jumping into kurtosis, let's summarize how we got here. As found in the previous moments, our attention has been drawn toward the center of the distribution. However, each subsequent moment has been steadily moving away from that center. While the earliest moments accept the world as more certain, the last two moments acknowledge the volatility inevitably present in our lives.
Kurtosis has the opposite attention focal point. We will now focus on the tails or outliers of those distributions. As we will discover, the way of thinking in the tails is VERY DIFFERENT than the thinking in the center. Kurtosis, or 'thickness of tails,' helps us understand the degree to which uncertainty impacts a distribution. In our big block, multiple unknown paths exist in the big block. These are the dark, solid uncertainty lines (Y3) representing unknown outcomes.
Y3 Uncertainty Paths

Human systems typically display fat-tailed distributions, meaning uncertainty is even more prevalent than in the thin tails of a normal distribution. Fatter tails emerge because the central tendency in human systems is shaped by many attractors beyond gravity—legal rules, social norms, incentives, reputational pressures, and path-dependent habits. Each additional attractor increases the chance of observations being pulled into the tails. When these forces interact in unexpected ways, they amplify extreme outcomes even further.
Tail thickness, measured by kurtosis, exposes why traditional risk measures often fail in dynamic, human-centered systems: they rely on an assumption of normality that rarely holds. This assumption itself is like a prior—a belief about how the world is structured. As we will see later, Bayesian inference provides a way to evaluate and update these priors, helping us properly manage the uncertainty concentrated in the tails.
The great financial crisis of 2008–09 is an example. The compounding complexities of the environment led to loss outcomes not anticipated in the normal space. Multiple competing attractors—such as excessive risk-taking by financial institutions, widespread mortgage fraud, regulatory failure, and an overreliance on flawed credit rating models—interacted in unpredictable ways. Forces identified by the Congressional inquiry created feedback loops, pulling the system far from equilibrium. Each attractor added instability, and together they produced a fat-tailed outcome far more extreme than traditional models had forecast. It was the layering of dynamic risks and exponential growth leading to losses only predictable in the context of thick tails and excess kurtosis. Nicholas Nassim Taleb is an author, researcher, former bond trader, and expert on fat tails. He offers a cautionary suggestion for kurtosis:
"Everything in empirical science is based on the law of large numbers. Remember that it fails under fat tails." - N.N Taleb
Excess kurtosis means that large losses, such as a massive sell-off in the stock market or massive, longer-term drops in home prices are more possible than a normal view of the world suggests. But it is not just losses, great unexpected gains may be achieved from excess kurtosis. As we will explore, kurtosis is agnostic to the valence of the outcome, whether a loss or a gain. Exponential growth and general convex functions are common to the transformation of many distributions, including distributions with excess kurtosis. An example of a convex function is the time value of money associated with personal finance. But many other convex functions are impacting our lives - such as health and longevity. The degree of kurtosis exposure is agnostic to outcomes of convex function transformations - which means outcomes can be good or bad.
Convex functions in the context of personal finance. Convexity has a specific, bounded usage in personal finance.
1) Shape and space – The modeled time value of money function is “convex to time.” This means it increases at an increasing rate in positive time and positive outcome value space. A personal finance application convex to time cannot go negative to time. Also, over the long run of multiple business cycles, consistent investing, and a properly diversified portfolio, the function will not go negative to outcome value.
2) Volatility management – In the long run, there is an equal chance of positive or negative volatility occurring in the short term. The time value of money function is “convex to time” and exposed to this stochastic volatility. As such, the diversified portfolio holder will benefit more from upside volatility than downside volatility in the long run. Diversity ensures no sinle investment causes ruin, so the downside is limited. But the upside is unlimited. N.N Taleb coined the term “antifragile,” in the book by the same name, to represent this assymetric, positive investment outcome.
Please see a discussion of Jensen's Inequality to demonstrate convex functions and how it is applied to personal finance.
Manage your Fat Tails

The idea is to expose yourself to convex functions in a way that increases the chances of good outcomes, plus the value gained from those good outcomes, and minimizes the chance and severity of bad outcomes, regardless of the tail thickness. All the while, protecting oneself from ruin. The best way to achieve good outcomes is to make sure ruin does not prevent you from playing the game enabling that good outcome.
Think of healthy personal habits and saving for retirement as ways to expose yourself to convex functions that drive good outcomes. These good outcomes may be benefited by thick tails. Think of high deductible health insurance as protection from a bad outcome and automated savings as contributors to a good outcome. A properly protected convex function is more likely to benefit from thick-tailed distributions. For example, if the stock market has thick-tailed volatility and the investor:
Has a long investment time frame,
Diversification to protect from fat tail-based ruin, and
Makes regular investment contributions,
The investor WILL benefit more from exposure to volatility and the upside of fat-tail volatility than suffer losses from the downside.
Please see the article to explore practical convex function applications:

Managing thick tails is very different than managing central tendencies. Consider ruinous events, such as a house fire or cancer. By our behaviors - like safety, exercise, and healthy eating - we can reduce the chance of those fat tail events. But they do happen. This is why insurance - like high deductible health insurance or fire insurance - is a great ally to manage your fat tails.
High deductible insurance has 2 benefits, with the second being more powerful than the first:
High deductible insurance will cover the top-end risk of some ruinous event. High-deductible insurance is generally less costly than lower-deductible policies. One is usually better off saving for some loss event beneath the higher deductible policy than insuring it with a low deductible policy.
Since high deductible insurance does not cover less costly events below the high deductible - the insured still has skin in the game. Thus, high deductible insurance keeps the insured focused on behaviors reducing the chance of that fat-tail event from occurring in the first place. This is called "de-moral hazarding." The next article provides additional de-moral hazarding context.
In the U.S. especially, high deductible insurance purchased outside an employer has a third benefit. Making insurance portable makes it easier to change employers. This uses the same reasoning as 401(k)s and pensions for retirement. 401(k)s, by definition, are portable and make it easier to change employers. For health insurance, employers have the option to contribute to tax-benefited accounts called Health Reimbursement Arrangements or HRAs. This allows an employer to provide funding for employees to purchase health insurance plans on the ACA website.
Managing risk is different than managing ruin. Risk is considered through probabilities, central tendencies, and expected outcomes. Risk can be objectively managed with the help of the law of large numbers. Risk management planning will direct resources to lessen or eliminate risk severity - should a risk be realized.
Ruin, on the other hand, is to be avoided. Ruin is an end point - there are no do-overs. Ruin is managed via the "law of small numbers." Since ruin lives in the tails of uncertain distributions, the first three moments are less helpful. Insurance and personal behaviors to handle potentially ruinous events are essential.
Fat tails and de-moral hazarding - a banking example:
In the world of banking, large banks depend on taxpayer bailouts to protect from ruinous events. Fiscal stimulus programs associated with the financial crisis and the pandemic are bailout examples.
For example, Robert Rubin is the former CEO of Citibank. He was the CEO before and during the financial crisis. Rubin became very wealthy as the CEO, in part, because he made outsized banking bets before the crisis. Those bets exposed Citibank to the risks leading to the financial crisis. U.S. taxpayers bailed out Citibank and Rubin. Rubin kept all the compensation he earned while guiding Citibank to take those banking systems existential risks. Unfortunately, banks do not get the skin in the game advantage of de-moral hazarding. Perhaps society would be better off if they did.
In an interview with Business Insider writer Matthew Boesler, N.N. Taleb said:
“Nobody on this planet represents more vividly the scam of the banking industry,” says Nassim Nicholas Taleb, author of The Black Swan. “He [Robert Rubin] made $120 million from Citibank, which was technically insolvent. And now we, the taxpayers, are paying for it.”
To be fair, Taleb is picking on Mr. Rubin. Pretty much all senior operating executives from large banks could be called out for their lemming-like competitive behavior and how they profited leading up to the financial crisis. These senior executives could fairly claim they were just doing their best given the environment of the time. History will judge whether their claims are fair or not.
Please see the article to explore fat tails and the difference between risk and ruin. The article is presented in the context of entropy's operational cousin, known as 'ergodicity:'

Finding the unknown: The big block shows the “unknown, unknown” as a dark line (Y3). This means those unknowns exist but we do not know where they are. Economist Russell Roberts defines the problem well when he says: “By focusing on what you know and about what you can imagine, you’re ignoring the full range of choices open to you.” [viii-a] Also, Thomas Schelling said: “There is a tendency in our planning to confuse the unfamiliar with the improbable.” [ix] So, what do we do about it!? How do we find the unknown, unknown, when, well, it is unknown? We have already discussed managing the downside of the unknown, unknown. Next we will discuss how to actively capture its upside.
In a word, the answer points us toward actively engaging with serendipity. [viii-b] According to Merriam-Webster’s dictionary, serendipity is “the faculty or phenomenon of finding valuable or agreeable things not sought for.” Earlier, N.N. Taleb was introduced. As an example, Taleb suggests one of his favorite pastimes is "flaneuring," which is his way of exposing himself to the convexity benefits of serendipity. Thus, flaneuring is an input to the serendipity convex transformation function. This is just like savings are an input to the time value of money convex transformation function and healthy habits are an input to our long-term health convex transformation function.
Flaneuring is purposely exposing oneself to an environment where a positive unknown may be uncovered. A serendipitous outcome of flaneuring is when understanding from a former unknown (Y3) is moved to one of the known paths (Y1 or Y2). I do this by being around people or situations I am unfamiliar with - but hope they could have something interesting to share. Attitude is important. While I purposefully seek to engage in serendipitous environments, I do not pressure the environment with high expectations. However, after every encounter, I am careful to self-debrief and capture the cool stuff I gleaned from the encounter. The 'de-brief and glean' is that essential step of capturing heretofore unknown data. This is a potential starting point for moving from the unknown (Y3) path.
My work as the curator of The Curiosity Vine provides these opportunities. I have had many interesting discussions with potential idea incubators. Not all of them turn into something “known.” But all the conversations add value to the “unknown” that may someday, move into a “known” path on my big block. Also, I consider these interactive discussions as symbiotic. That is, I am learning from someone's known Y1 or Y2 path, at least part of which may be found on my unknown Y3 path. The opposite occurs, I share from my known Y1 or Y2 path to potentially inform their unknown Y3 path.
It takes a bit of faith to invest in something that has no short-term, measurable return. It takes an open mind to discuss something that is far afield from what is known. The good news is, I can flaneur on the side. While I spend most of my time on the known (Y1) or managing the risk (Y2) paths found in the big block, I consistently make time for achieving serendipity found in the unknown (Y3). Honestly, I wish I could spend more time on the unknown. It is incredibly interesting and a source for feeding my voracious curiosity.
For an example of a successful idea incubation and moving the unknown Y3 path to the known Y1 and Y2 paths, please see:
Serendipity, however, is not limited to Taleb’s flaneuring. It can be cultivated in many ways—through weak-tie networks, cross-disciplinary collisions, intentional play, and even the entrepreneurial act of stepping into the unknown to create new products and services. Each of these practices raises the probability that today’s coincidences become tomorrow’s opportunities. This perspective reframes luck, shifting it from something passive to something cultivated through preparation, adaptability, and pursuit energy. For a deeper dive into how to operationalize serendipity and use it as a tool for innovation and opportunity, see my article:
The unknown as a path to innovation: Dealing with uncertainty, or the "unknown, unknown," is an area of intelligence that is uniquely human and has a comparative advantage relative to artificial intelligence.
“What is now proved was once only imagined.“
- William Blake (1757 - 1827)
Why? The known and risk paths are the domain of artificial intelligence. These are paths that are informed by existing data. Artificial intelligence is far better at assimilating and organizing massive stores of data than humans. However, AI can only provide a forecasted outcome in the context of the data it is trained upon. It is the unknown that, by definition, is void of existing training data. It is the human ability to deal with counterfactuals and apply intuition and creativity that makes us uniquely able to handle the unknown. This is the domain of innovation.
Most innovators seek the Y3 or the unknown, unknown path. They are motivated to uncover improvements to the existing world by providing solutions to challenges not already known. Innovators start by building a deep understanding of the known (Y1 and Y2) and understanding the gap between that known and what could be to help people (Y3). They seek to bridge that gap with some invention or related new approach. The invention or new approach is only part of the solution. It is the innovator, via using a trial and error process, that creates new data in the service of closing the gap from the unknown to the known. The magic of building new data and moving from the unknown to the known comes from this innovation process.
Updating beliefs helps uncover the unknown: Serendipity and innovation have been discussed as approaches to uncovering the unknown. But there is a deeper question of how to encourage serendipity and innovation. Earlier, we intoduced the nimble decision-maker in a video. Central to being a nimble decision-maker is belief updating. Albert Einstein said:
“Whether or not you can observe a thing depends upon the theory you use. It is the theory which decides what can be observed.”
This is an incredible observation made long before the existence of AI and the systematic collection of data. An AI does not need a theory. It predicts the future based on the data it can see. However, it is the unseen that is often necessary to accurately predict the future.
Einstein’s saying suggests that our unknown Y3 path may be uncovered by changing our theory. This is like looking under rocks we did not know were there. Also, as discussed in the introduction, our theory or perspective is greatly variable. Our own perspective is likely different than others and even our own perspective is impacted by time and the situation. Variability, how we sample, and the influence of cognitive biases will impact how we form beliefs. Being aware of and actively engaging our natural variability is part of innovation.
This is why being clear about your own benefit model and updating that model is so important. Earlier, personal algorithms and choice architecture were introduced. Beliefs are impacted by the quality of our personal algorithms. We may actively impact these beliefs by our willingness to proactively uncover the Y3 unknown path.
Some may believe the goal is to find and fix a belief they can consistently rely upon. Our goal is different. To capture our uniquely human comparative advantage, the revised goal is to:
Recognize the world is so dynamic that fixing beliefs is not advisable.
Current beliefs are like temporary weigh stations on the journey to uncover the ever-changing Y3 unknown paths.
The better goal is to grow your decision process to consistently consider, test, and update beliefs. The human comparative advantage to AI is that we can imagine counterfactual but plausible worlds and then create unique data to test that imagined world.
Belief updating is an evolutionary process, where new, environmentally tested ideas are grown and old, environmentally fragile ideas contract.
In the context of innovation, new or revised beliefs may be considered as a set of possibilities needing to be tested.
7. Fooling Ourselves
A moment of ignorance
To finish the big block path discussion introduced earlier, please note the fourth Y4 ignorance path found at the bottom of the big block graphic. This is where we thought a path was known – either the white solid or white dotted line – but turns out to be something different. As explored via the following HRU framework, the "unknown, known" of ignorance is generally a worse state than the "unknown, unknown" of uncertainty.
Y4 Ignorance Paths

This is because we fooled ourselves, at the time a decision needed to be made, into considering a belief to be in the known outcome category. Ultimately, upon a post-mortem inspection, we determined we made a mistake about the potential outcome. It becomes clear the outcome was knowable, but we failed to properly assess the data at that decision moment. This kind of error reflects epistemic uncertainty—the knowledge existed, but we failed to recognize or use it effectively. As a point of clarification, the reasoning error is more likely to be an error of omission. The data was available, but either misweighted or ignored altogether and would have been helpful to make a better assessment. "Fooling ourselves" relates to the trope:
"It seemed like a good idea at the time."
At least when something is on the Y3 unknown path, we can still use our belief-updating process to inform and update that belief. Also, as in the case of the Y2 risk path, we knew something was possible and the probability that it may or may not happen. However, in a state of ignorance, as found on the Y4 path, we do not even know that a belief should be updated or considered a risk. "It seemed like a good idea at the time" is often an expression of regret for not updating a belief to better impact an outcome.
As introduced in the "Don't Be a Blockhead / Unity" section, the graphic described "The Big Block's" four Y outcome types. We describe those 4 paths along 2 time-based dimensions:
Situation or what we know today (This is like the "X" plane from the big block)
Outcome or what the uncertain future holds. (This is like the "Yn" paths from the big block)
As a reminder, those four Y outcome types are:
Y1 - Known - or the "Happy Place" starting point,
Y2 - Risk,
Y3 - Unknown, and
Y4 - Ignorance.
"Fooling ourselves" with ignorance is common and occurs because of a lack of belief updating. Ignorance is the outcome of persistent confirmation bias. Reducing ignorance is the clarion call for understanding your data and having a robust belief updating process. Reducing ignorance is served by having a consistent, repeatable decision process. Earlier, the Definitive Choice app and a Bayesian approach were suggested to implement the best day-to-day decision-making process.
Why is ignorance common and a big challenge? Ignorance, or the “unknown, known” is a feature of our neurobiology. You saw that correctly – “ignorance is a feature!” Our brain’s ability to update evidence and knowledge takes work. Whereas, our fast-brain-oriented responses occur based on the habits presented from existing evidence and knowledge. If a lion is bearing down on you, our slow-brain-oriented response is to calculate the proper exit direction and speed. Whereas our fast brain response is to "run, now!" Naturally, we exist and our direct ancestors survived because their evolutionary instinct was to act quickly with their fast brain and avoid becoming a lion’s snack.
It takes real work to update evidence, knowledge, and resulting beliefs—just like navigating a technical hiking trail. Each step requires deliberate micro-forecasting, forcing your brain to process terrain, balance, and momentum in real time. That mental effort consumes energy—literally burning calories—as you adapt to new conditions. It is no surprise that many of us default to the easier path: reacting based on existing beliefs formed from familiar memories. But if we want better decisions, we have to train our minds the way a hiker trains for elevation—one step, one update, one recalibration at a time.
Memory is based on an existing network of neurons and synapses. The strength of that memory is based on the number of neurons and both the number and size of those synaptic connections forming that memory. The more and bigger the neurons and synaptic network, the stronger the memory and corresponding habits. That is why a strong habit is so challenging to change, a habit “feels” normal, regardless of whether it is a good habit or not.
But here is the thing—existing memories create inertia. So, if you have a “known, known” that evolves into an ignorant “unknown, known,” you are much less likely to perceive it as an ignorance signal in need of updating. That is because your habits are still relying on old, “feel good” memories to support a belief. Belief inertia is at the core of confirmation bias—we seek consistency with past experience rather than accuracy in present data. Today's fast-moving data-abundant world creates the potential for belief inertia.
This is why Robyn Dawes warned against blind trust in personal experience: “(One should have) a healthy skepticism about 'learning from experience.' In fact, what we often must do is to learn how to avoid learning from experience.” His insight reveals that the patterns we internalize through repetition are often misleading—especially when they go unexamined.
That is why having a robust belief updating process, especially in the data abundance era, is so important. Without it, our minds default to patterns that once served us well but now quietly misguide us.
The information age only increases the likelihood of being impacted by ignorance. As data availability explodes, so does the cost—both cognitive and temporal—of curating what is relevant, accurate, and contextual. Ironically, the abundance of data can deepen ignorance by overwhelming our capacity to discern signal from noise. In a world saturated with information, the default response is often to disengage, revert to habit, or follow the crowd.
This irony is not lost on consumer platform companies and political actors. Many actively exploit information overload, using it as a strategy to steer behavior. By flooding people with data, they increase friction, encourage default choices, and disproportionately benefit from decisions made without deliberate attention. Today, the owner of the default choice, usually large organizations or political parties, have a massive advantage because of growing belief inertia.
"The Fast Brain" and the human ability to forecast were discussed earlier and cited with Inside Your Brain: The Hidden Forces Behind Every Decision You Make. The "high emotion tag & low language case" is related to those habits providing fast access to memories but also belief inertia potentially leading to ignorance. The "low emotion tag & high language case" is related to the slower updating process necessary to change or reinforce those habits.
To be clear, it is not that ignorance should be avoided at all costs. There is a difference between the temporary ignorance associated with learning by trying something new and the persistent ignorance associated with confirmation bias. Part of learning is trying new stuff and doing as well as we can. You may think you know something about an outcome and want to give it a try. When there is an unknown, 'giving it a try' is code for testing and creating data to update our outcome path understanding from the Y3 unknown path to a Y1 or Y2 known path. However, getting stuck in those outcome beliefs and not updating is the ignorance we should strive to avoid. The new data may suggest your tested belief was wrong. Being a good data explorer is about properly introducing outside-in data and updating as we learn. One powerful way to generate that outside-in data is through serendipitous exploration, as discussed in the "The Tale of Tails" Kurtosis section. Practices like flaneuring—intentionally placing yourself in unfamiliar environments—create opportunities to uncover valuable unknowns. This approach is a deliberate countermeasure to confirmation bias, enabling belief updating by converting unknowns (Y3) into known paths (Y1 or Y2).
There is an old saying that encourages people to try things, even if they do not have the skills or data YET to be successful at that thing:
"Fake it till you make it"
This an aphorism encouraging the projection of confidence, competence, and an optimistic mindset to achieve the desired results. It involves consciously cultivating an attitude, feeling, or perception of competence that you don't currently have by pretending you do until it becomes true. This is a great way to cultivate habits to achieve an aspirational objective. This is a means to create new data.
I like the aphorism but also believe that aphorism has the potential to devolve into ignorance. What if that aspirational objective devolves to be inaccurate? Following a belief updating process will help you know whether or when to stop faking and cut bait or, alternatively, fake it in another direction. In the next example, we will demonstrate how habits begun in liberty devolved into the death of Americans at American hands.
January 6th, 2021, an ignorance example: Consider the highly sensitive matter of the January 6, 2021 storming of the U.S. Capitol. This attack resulted in the death of Americans at American hands. As stated in the U.S. Congressional Committee investigation report: [x]
“The Committee’s investigation has identified many individuals involved in January 6th who were provoked to act by false information about the 2020 election repeatedly reinforced by legacy and social media.”
This has all the markings of confirmation bias and both errors of commission and errors of omission. The attackers believed, and may still believe, the attack and killings were justified.
As revealed by the investigation, the attackers did not subtract false data - an error of commission - and ignored or underweighted moderating information - an error of omission. This is a classic decision-making challenge. At this point, the reader may feel that suggesting the January 6th attackers were impacted by ignorance seems judgmental. Fair enough. For this example, the author’s perspective is generally based on American law and cultural expectations:
1. Do Americans have the right to protest? - YES, of course!
2. Do Americans have the right to kill or maim while protesting? - NO, of course not!
3. Do Americans have the responsibility to curate data and weigh all the facts? YES!
Perhaps, if the January 6th attackers had spent more time curating data and inspecting their beliefs, the outcome would have been different.
When evaluating a new situation, be on the lookout for those decision inputs that may be a deal killer. This means that if there is something that is a necessary input to the decision and not completing it would ruin the decision, then be hyper-focused on managing that risk to the desired outcome. Either eliminate that risk or quickly "kill the deal" if the risk is unable to be eliminated. Salespeople sometimes call deal killers "Fast to No." This is used when pursuing a possible sales lead. If the sales lead is not going to pan out, a good salesperson will quickly "kill the deal" by prioritizing other leads. Unfortunately, these kinds of deal killers sometimes get ignored longer than they should. This is a source of ignorance.
Good salespeople also know that deal killers may change over time. So, perhaps they "kill the deal" today, but they seek to maintain a relationship with those parties from the killed deal. If the environment changes and that "necessary something" changes to be viable, then they will "unkill the deal" and seek the beneficial outcome.
The Monkey and the Pedestal is a fun parable to help remember to focus on deal-killer risks.
You want to get a monkey to recite Shakespeare while sitting on a pedestal. What do you do first? Train the monkey or build the pedestal? It’s obvious that training the monkey is a much harder task, and it’s quite likely that we are tempted to start with sculpting a beautiful pedestal instead. But if we can’t get the monkey to recite the monologues on the ground, then all the time and energy put into crafting the pedestal are wasted.
- Astro Teller, the head of X, Google's moonshot division
Systemic bias: Up to this point, it has been shared how data, or our past reality, may be understood via the language of statistics. Systemic bias is different. This is where you could be fooled into believing the data represents our past reality when, in fact, the data becomes more deceiving than helpful. Supporting this point, the late Harvard scientist and systems researcher Donella Meadows said:
“…. most of what goes wrong in systems goes wrong because of biased, late, or missing information.”
Systemic bias, also known as structural bias, is another sink for ignorance. This is where the data itself may lead to an inaccurate conclusion. Take credit scores, for example. Traditional scores like FICO rely on banking data—capturing behaviors of those already inside the formal financial system, often the dominant social class. But millions of “unbanked” individuals—disproportionately from minority communities—pay rent, utilities, and informal loans reliably, yet these behaviors are more likely to be excluded. The result is a systemic underrepresentation of creditworthy behavior, leading to artificially lower scores and reduced access to credit for those outside the system. Earlier, we discussed Sir Francis Galton and his contribution to statistics and the normal distribution. In the notes section, we explore how Galton leveraged the language of statistics, a variant that he called 'eugenics,' to further his and his contemporaries' racist beliefs. As a counterpoint to Galton's misguided use of statistics, Nobel laureate F.A. Hayek coined the word “scientism” to mean:
“not only an intellectual mistake but also a moral and political problem, because it assumes that a perfected social science would be able to rationally plan social order.” [xi]
It is that scientistic assumption - "a perfected social science would be able to rationally plan social order” - that is more likely to lead to a systemically biased outcome. This was certainly the case in Galton's eugenic applications of statistics. [xii]
Systemic bias leads to systemic discrimination. Systemic discrimination is a form of institutional discrimination impacting economic agents, such as race or gender, which has the effect of restricting their opportunities. It may be either intentional or unintentional, and it may involve either public or private institutional policies. Such discrimination occurs when policies or procedures of these organizations have disproportionately negative effects on the opportunities of certain social groups.
The theory of structural discrimination is generally researched by sociologists. Systemic discrimination is also known as structural discrimination.
Specific to home ownership and mortgage lending, please see this home appraisal bias as an example of structural bias.
This may seem discouraging. Yes, data can be incomplete, misleading, or even manipulated. But in an age of data abundance, that is the reality—not the enemy. Data is now a natural constant in our lives, and it is growing faster than our ability to process it. It simply reflects our past reality, waiting to be interpreted. The real danger lies not in the presence of data, but in the failure to understand it.
That is why statistics is the essential language of the information era—a grammar for translating data into meaning. With it, you gain the power not only to understand patterns and probabilities but also to call out misuse, whether from platforms, politicians, or well-meaning professionals. You do not need to fear data. Instead, learn to read it fluently.
As we discussed in the introductory section, the hunt is to better understand the grammar rules, so we can:
Learn from our past reality,
Update our beliefs, and
Make confidence-inspired decisions for our future.
I encourage you to be an active data curator—seek clarity, challenge systemic bias, and stay open to belief revision. As your fluency in the language of data grows, your chances of being fooled by ignorance shrink. That is how you turn data abundance into decision advantage.
To further explore challenges in the data-abundant era, please see the article:
To further explore being a data curator, please see the article:
Pulling it together - a statistical moments though experiment
Earlier, the Galton Board helped us see how a normal distribution emerges when gravity alone acts as the attractor—calm, predictable, and independent. But life rarely unfolds in such calm air. Imagine placing a fan beside the board. Each gust of wind represents human intervention, chance events, or social pressures—forces that bend outcomes away from the tidy symmetry of normality.
Moment 1 (Expected Value): A steady side wind shifts the average, pulling the center off balance.
Moment 2 (Variance): A gust from above scatters the balls more widely, stretching outcomes to the extremes.
Moment 3 (Skewness): A directional breeze pushes outcomes disproportionately to one side.
Moment 4 (Kurtosis): Intermittent, shifting winds fatten the tails, amplifying rare but extreme events.
Ignorance: And when the wind reverses—first left, then right—our greatest risk lies in clinging to old wind direction assumptions instead of updating our priors.
Like life, the winds change without notice. The challenge is not to wish for calm air, but to prepare for motion—to recognize when the attractors have shifted, when variance widens, when tails grow fatter. Winning the data war means not only understanding the grammar of statistical moments but also having the courage to update beliefs when the winds blow differently than before.
The experiment leaves us with a question: When the next gust arrives, will we cling to yesterday’s calm, or will we adjust our sails and move forward with clarity?
Please see this video for a wind-capturing adaptability perspective from Stanford University Entrepreneurship Professor Tina Seelig and Venture Capitalist Natalie Fratto.
When Normality Fails: Thought Experiment Meets History
Like life, the wind blows in unexpected ways. Earlier, we used the Galton Board as a metaphor for statistical moments in a calm, gravity-only world. But what happens when we add new attractors — like a fan creating wind? Suddenly, the elegant bell curve distorts: variance widens, skewness emerges, kurtosis fattens. A system once predictable becomes turbulent.
This thought experiment illustrates how assumptions of normality can blind us. Normality suggests extreme outcomes are vanishingly rare. Yet in human systems, fat tails are the rule, not the exception. When leaders mistake fat-tailed risks for “one-in-a-million” events, they build fragile systems — and history provides costly reminders.
Historical examples of the normality error [xiii]:
2008 Financial Crisis: Mortgage risk models treated cascading defaults as statistical impossibilities. In months, $19 trillion in global wealth evaporated.
LTCM Collapse (1998): A hedge fund built on normality assumptions blew up when fat-tailed bond spreads appeared, nearly toppling the global system.
Pearl Harbor (1941): Military planners assumed attacks would follow “normal” sabotage patterns. A full-scale airstrike was dismissed as too improbable.
9/11 (2001): Intelligence expected hijackings to end in hostage negotiations, not planes as weapons. The unimaginable sat outside the modeled distribution.
Fukushima (2011): Safety models assumed “normal” seismic activity. An extreme earthquake-tsunami pair exposed the fragility of the system.
Taken together, these failures show why the normality error is such a big deal: it repeats, it compounds, and it reshapes history. Leaders, investors, and engineers underestimated how often extremes occur — not once, but over and over.
Final takeaway: The grammar of statistical moments helps us recognize when winds of uncertainty bend distributions. But avoiding the normality trap requires going further. Tools like Bayesian inference (discussed later) allow us to bring in priors, acknowledge diversity, and prepare for tails. In the data war, it is not enough to know averages — we must respect fat tails, anticipate wind, and build resilience against the shocks most likely to define our future.
8. Next Steps: Better Living by Being Bayesian and Practicing Pareto
Being Bayesian and the statistical moments' map
Up to this point, we have explored how data abundance creates both opportunity and challenge—abundant signals, but also noise, bias, and the risk of fooling ourselves. The real question is: how do we turn this messy past reality into a disciplined framework for better decisions?
Having an intuitive grasp of the statistical moments is already a powerful advantage in the data war. They help you see patterns, volatility, and the limits of normality in a way most people cannot. But the next level of thinking is this: How can I apply my unique situation to get the most from my understanding of the world, informed by that data?
The full field of Bayesian inference is beyond the scope of this article. What we will do here is provide an introduction—enough to show how Bayesian thinking can help you win the data war by managing your unique data more effectively. The goal is not to make you a statistician, but to give you a taste of how Bayesian reasoning anchors decisions in your priors, updates them with evidence, and resists the pull of bias. For those who want to go deeper, resources for exploration will be provided.
A core discipline in Bayesian inference is knowing your priors—the beliefs and baseline assumptions you bring to a decision before new evidence arrives. This is not a technical footnote; it is a recognition of human diversity. As discussed in Our Past Reality is Diverse, no two people share the same history, incentives, or environments. Therefore, no two decision-makers begin with the same priors. Bayesian reasoning respects this heterogeneity by updating your beliefs in light of your evidence, rather than enforcing a generic average.
Classical statistics often behaves as if gravity is the only attractor—a calm, symmetric world where independent forces pull observations toward a single center. Functionally, that assumption treats everyone’s priors as identical. In real life, decision outcomes are rarely governed by a single force like gravity. Instead, they are pulled by a variety of attractors—legal rules, social norms, incentives, reputational pressures, and the habits formed by our own past choices. These forces interact with our upbringing and genetic wiring, bending outcomes away from symmetry and ensuring that no two people share the same starting point. These forces bend outcomes away from symmetry and away from a one-size-fits-all starting point.
Yet there is a gray line: not all experiences should shape your priors equally. Robyn Dawes warned that the challenge is “not learning from experience.” Some experiences are representative and useful; others are distorted by bias or emotion. A single bad investment, for instance, may tempt you to overgeneralize when statistics suggest diversification is the real lesson. Bayesian reasoning respects your lived experience but forces humility—signal must be separated from noise.
This discipline is also how you win the data war. Consumer platforms will always have more raw data than you, but it is optimized for their objectives, not yours. By applying Bayesian inference to your data—anchored in your priors, refined through evidence, and corrected for bias—you can leverage your data diversity and make sharper decisions. Bayesian inference also recognizes two uncomfortable realities. First, because people are incredibly diverse, probability and rationality are more judgmental and less objective than we might wish to believe—your priors will never look exactly like mine. Second, when statistics are applied as if people are all the same, the results can be destructive. History gives us stark reminders, such as the eugenics program supported by Francis Galton, where statistical reasoning divorced from individual diversity fueled harmful policy.
Please see the following article for the Bayesian inference approach and an example of using Bayesian inference to make a job change decision. Bayesian inference is a time-tested belief-updating approach VERY relevant to today’s world. Bayesian inference enables us to make good decisions by understanding our priors and appropriately using new information to update our beliefs. Bayesian inference helps us use our good judgment and overcome our cognitive biases. The Definitive Choice app is presented to implement a Bayesian approach to your day-to-day decision-making.
For an example of using Bayesian inference to help make a decision after a scary terrorist attack, please see the article:
As we discussed near the beginning, Bayesian Inference and Definitive Choice are types of personal algorithms. They implement a robust personal decision process as an outcome of being a good data explorer.
Practicing Pareto
Another powerful decision-making lens is the Pareto Principle, more commonly known as the “80/20 rule.” Pareto observed that a small share of causes often accounts for the majority of outcomes—20 percent of the population held 80 percent of the wealth in 19th-century Europe, and similar patterns repeat in business, health, and daily life. For our purposes, Pareto is less about the precise ratio and more about the mindset: focus attention on the vital few factors that truly drive results and avoid being consumed by the trivial many.
In our day-to-day lives, Pareto also teaches that the pursuit of value comes at a cost. Early gains often require relatively little effort, but as higher levels of value are pursued, the costs of achieving that extra benefit rise even faster. At some point, the marginal cost outweighs the marginal benefit—and that is the signal to stop. The challenge, of course, is that most people do not know when to stop. We chase perfection when “good enough” would deliver greater long-term benefit. The real wisdom lies in recognizing when enough is enough and in knowing when to redirect those same achievement habits toward a new area where the returns are higher.
In practice, this means recognizing that good habits, applied consistently, often deliver far more value than chasing the elusive “perfect” habit you cannot sustain. Just as Bayesian inference helps us personalize how we update beliefs, Pareto helps us prioritize where to direct scarce time and attention. Together, they form a complementary pair: Bayesian inference calibrates belief, while Pareto allocates effort. A full treatment of Pareto—complete with case studies in finance, health, and relationships—is beyond the scope of this article.
For readers who want to explore further, see Our Trade-off Life: How the 80/20 rule leads to a healthier, wealthier life, which dives deeper into how Pareto thinking helps build healthier, wealthier, and more resilient lives.
9. Conclusion
Just like grammar rules shape language, statistical moments form the grammar of data, guiding how we understand and respond to our past reality. But these are not passive rules—they are tools that reduce entropy, sharpen intuition, and help us thrive in the complex systems of the Information Age. And, like any language, fluency comes with practice.
Data is not just a record—it is a mirror of where we have been and a compass for where we might go. Yet as powerful as that compass is, we must remember: the map is not the terrain. Representation is not reality. Dynamic systems evolve. Unexpected outcomes will arise. That is why building statistical intuition—paired with humility—is your superpower in an uncertain world.
When you learn the language of statistical moments, you gain the ability to recognize patterns, question assumptions, and adapt with confidence. You become equipped not just to follow the data, but to challenge it when needed—to update your beliefs, minimize ignorance, and build a resilient framework for better decisions.
As Gene Roddenberry said, “The effort yields its own rewards.” And as George Box wisely reminded us, “All models are wrong, but some are useful.”
Our charge, then, is to make them useful—by being intentional curators of data, mindful of its limits, and bold in our pursuit of understanding. This is the heart of being Bayesian and practicing Pareto. And with tools like Definitive Choice, you can turn insight into action—one informed decision at a time.
More examples and context are found in the article:
For a framework and a pet purchase example for productively leveraging consumer product company's AI and algorithms in the average customer's life, please see the article:
Appendix - How well are algorithms aligned to you?
This appendix supports the "This article is about data, not algorithms" disclaimer found at the end of the introduction.
Generally, public companies have 4 major stakeholders or "bosses to please" and you - the customer - are only one of the bosses. Those stakeholders are:
The shareholders,
The customers (YOU),
The employees, and
The communities in which they work and serve.
Company management makes trade-off decisions to please the unique needs of these stakeholder groups. In general, available capital for these stakeholders is a zero-sum game. For example, if you give an employee a raise, these are funds that could have gone to shareholder profit or one of the other stakeholders.
This means the unweighted organizational investment and attention for your customer benefit is one in four or 25%. The customer weight could certainly be below 25%, especially during earnings season. Objectively, given the competing interests and tradeoffs, this means a commercial organization's algorithms are not explicitly aligned with customer welfare. Often, the organization's misaligned algorithm behavior is obscured from view. This obscuring is often facilitated by the organization's marketing department. Why do you think Amazon's brand image is a happy smiley face :) For more context on large consumer brands and their use of algorithms please see the next article's section 5 called "Big consumer brands provide choice architecture designed for their own self-interests."
The focus on data will help you make algorithms useful to you and identify those algorithms and organizations that are not as helpful. Understanding your data in the service of an effective decision process is the starting point for making data and algorithms useful.
While the focus is on the data, please see the next article links for more context on algorithms:
An approach to determine algorithm and organizational alignment in the Information Age:
How credit and lending use color-blind algorithms but accelerate systemic bias found in the data:
Notes and a word about citations
Citations: There are many, many references supporting this article. Truly, the author stands on the shoulders of giants! This article is a summarization of the author's earlier articles. Many of the citations for this article are found in the linked supporting articles provided throughout. I encourage the reader to click through and discover the work of those giants.
[i-a1] Madrian, Brigitte C., and Dennis F. Shea. “The Power of Suggestion: Inertia in 401(k) Participation and Savings Behavior.” Quarterly Journal of Economics, 116(4), 2001, pp. 1149–1187.
Thaler, Richard H., and Shlomo Benartzi. “Save More Tomorrow™: Using Behavioral Economics to Increase Employee Saving.” Journal of Political Economy, 112(S1), 2004, pp. S164–S187.
[i-a2] Wansink, Sobal, Mindless Eating: The 200 Daily Food Decisions We Overlook, Environment and Behavior, 2007
Reill, A Simple Way to Make Better Decisions, Harvard Business Review, 2023
[i-b] The challenge of how high school math is taught in the information age is well known. The good news is that it is recognized that the traditional, industrial age-based high school "math sandwich" of algebra, geometry, trigonometry, and calculus is not as relevant as it used to be. Whereas information age-based data science and statistics have dramatically increased in relevance and necessity. The curriculum debate comes down to purpose and weight.
Purpose: If the purpose of high school is to a) prepare students for entrance to prestigious colleges requiring the math sandwich, then the math sandwich may be more relevant. If the purpose of high school is to b) provide general mathematical intuition to be successful in the information age, then the math sandwich is much less relevant. I argue the purpose of high school for students should be b, with perhaps an option to add a for a small minority of students. Also, it is not clear whether going beyond a should be taught in high school or be part of the general college education curriculum or other post-secondary curriculum. Today, the math sandwich curriculum alone lacks relevance for most high schoolers. As many educators appreciate, anything that lacks relevance will likely lead to not learning it.
Weight: Certainly, the basics of math are necessary to be successful in statistics or data science. To be successful in b) one must have a grounding in a). The reality is, high school has a fixed 8-semester time limit. Which, by the way, education entrepreneurs like Sal Khan of Khan Academy argue against tying mastery to a fixed time period. But, for now, let's assume the 'tyranny of the semester' must be obeyed. As such, the courses that are taught must be weighed within the fixed time budget. Then, the practical question is this: "If statistics and data science become required in high school, which course comes out?" I suggest the math sandwich curriculum get condensed to 4 to 5 semesters, with the information age curriculum being emphasized in 3 to 4 semesters.
The tyranny of the semester can be overcome with education platforms like Khan Academy. Since the high school math curriculum increasingly lacks relevance, an enterprising learner or their family can take matters into their own hands. Use Khan Academy outside of regular class to learn the data science and statistics-related classes you actually need to be successful in the information era.
[i-c] Upton Sinclair’s aphorism, "It is difficult to get a man to understand something, when his salary depends on his not understanding it." was suggested as why education system curriculum administrators will not lead the charge in updating older, industrial era math curriculum to the needs of the information age.
First, there is no doubt that there are many well-meaning and talented people administering education curricula. The challenge is one of incentives in terms of the administrator’s skills and the system itself. The best way to understand this challenge is with a home-building metaphor.
In the home building business, sometimes it makes more sense to tear down a house to its foundation than try to do a home improvement to the existing house. This is because:
The current house, while well built for the time, is now significantly out of style from current expectations. Perhaps today, people want more square footage, higher ceilings, more open floor plans, etc. These are significant changes to the current home.
The value of the land under the house is relatively high. In order to get the most out of the land value, the existing land improvement - or house- needs to be adjusted. Effectively, to get the most out of the environment -the land, how that environment is engaged - the house - needs to be changed.
The cost of a home improvement would be higher than tearing it down and building it from scratch.
Now, let’s apply this thinking to the curriculum administrator. The curriculum administers the high-value education system environment to provide the next generation of human capital. The curriculum administrator has built their career and commanded a higher salary by managing the industrial era curriculum. The administrator desires to tweak the curriculum to fit it into the industrial-era curriculum system they administer. However, the drastic changes to the curriculum needed are like a tear-down. The curriculum administrator's fear, whether accurate or not, is this: Once torn down, the curriculum administrator’s skills, geared toward the old curriculum approach, may not be as needed. Or, if needed, those skills will not be needed at the salary level they had formerly commanded.
Thus, the industrial era curriculum administrator’s incentives will naturally lead them to resist a curriculum ‘tear-down.’
[ii] Byers, The Blind Spot: Science and the Crisis of Uncertainty, 2011
[iii] Kahneman, Slovic, Tversky (eds), Judgement under uncertainty: Heuristics and biases, 1982
[iv-a] See Our Brain Model to explore 1) the parts of the brain lacking language, called the fast brain, and 2) people’s abilities to see through the big block.
a) The Fast Brain: The human ability to quickly process information through our emotions is anchored in the right hemispheric attention center of our brain. Please see the “The high emotion tag & low language case” for an example.
b) The Big Block: The human ability to forecast the future based on past inputs is anchored in the left hemispheric attention center of our brain. Please see the “The low emotion tag & high language case” for an example.
Hulett, Our Brain Model, The Curiosity Vine, 2020
[iv-b] Hulett, Jeff. “The Power of Practice and Specialization: Why Market Economics Expands Human Potential.” The Curiosity Vine, 2025.
[v] Luborsky, LaBlanc, Cross-cultural perspectives on the concept of retirement: An analytic redefinition, Journal of Cross-Cultural Gerontology, 2003
[vi] Francis Galton was a hardcore racist. To be fair, in the day, racism was commonly accepted as was the belief that certain races of people were naturally superior to others. However, he used his brilliant statistical insights to create an infrastructure of human discrimination called Eugenics. Among other uses, a) the Nazis used Galton’s ideas to support their genocide and b) the United States used Eugenics extensively. Many states had laws allowing "state institutions to operate on individuals to prevent the conception of what were believed to be genetically inferior children." The author is abhorred and saddened by Galton’s attitude, the general attitudes of the day, and the uses of Eugenics. However, the author does find Galton’s statistical research and development very useful. As well as the Galton Board is a very helpful explanatory tool for the normal distribution. History is replete with people with misguided motivations, as judged by history, but that created useful tools or technologies for future generations.
Another interesting historical note, Galton is a blood relative – a younger half-cousin - of Charles Darwin. The story goes that Galton was driven by family rivalry to make his own historical name.
Editors, Eugenics and Scientific Racism, National Human Genome Research Institute, last updated, 2022
[vii] Roberts (host), David McRaney on How Minds Change, EconTalks Podcast, 2022
[viii-a] Roberts, Wild Problems: A Guide To The Decisions That Define Us, 2022
[viii-b] Serendipity is neurologically rewarding because it activates the brain’s dopaminergic system, which is highly sensitive to unexpected rewards. This system, rooted in the brain’s reward prediction circuitry, plays a key role in motivation, exploration, and learning. Surprising positive outcomes—hallmarks of serendipitous experiences—trigger dopamine spikes, reinforcing behaviors that increase the chance of future discovery.
Schultz, Wolfram. “Dopamine reward prediction error coding.” Dialogues in Clinical Neuroscience, vol. 18, no. 1, 2016, pp. 23–32.
[ix] Wohlstetter, Pearl Harbor: Warning and Decision, 1962
[x] Congressional Committee Members, final Report Select Committee to Investigate the January 6th Attack on the United States Capitol, 117th Congress Second Session House Report 117-663, December 22, 2022, https://www.govinfo.gov/content/pkg/GPO-J6-REPORT/pdf/GPO-J6-REPORT.pdf.
[xi] Editors, Hayek and the Problem of Scientific Knowledge, Liberty Fund, accessed 2024
[xii] Next are some finer points of the author’s Hayekian perspective. First, F.A. Hayek came of age in pre-World War II Europe. He was born in Austria and moved to London as Nazism grew in post-World War I Europe. The counterpoint perspective between Galton and Hayek is strong.
Hayek was a classical libertarian who believed individual choice and responsibility were essential for the efficient functioning of sovereign economies. Hayek believed there was an important place for the rule of ex-ante law.
The author's Hayekian interpretation is that law should be considered like guard rails. Society should carefully consider and only implement necessary guard rails. Then, individuals should freely choose within those guard rails. Like The 10th amendment to the U.S. Constitution, Hayek would have liked the ex-ante provision where "The powers not delegated to the United States by the Constitution" are reserved for the people.
Also, people will certainly make mistakes and poor choices. But their mistakes and choices are still superior to those of a government bureaucrat, making choices on the individual’s behalf. This is for three reasons:
Information power: The individual has more local information about the decision and how it will likely impact them. The bureaucrat will use summary information to make a policy decision on the average for a diverse population.
Error-correction power: The feedback loop effectiveness for the individual in the case of a poor decision is much greater. The power of the error-correcting incentives is far greater for the individual than that of the bureaucrat on behalf of the individual.
Ownership power: An individual is likely to be highly motivated when they have a sense of ownership over their choice. Conversely, an individual will be highly de-motivated when that choice is made for them.
For a deeper F.A. Hayek perspective in the context of a modern example, please see:
Hulett, A Question Of Choice: Optimizing resource allocation and an HOA example, The Curiosity Vine, 2023
[xiii] Historical examples of the normality error sources:
Coval, Joshua, Jakub Jurek, and Erik Stafford. “The Economics of Structured Finance.” Journal of Economic Perspectives 23, no. 1 (2009): 3–25.
Frontline. “How Much Did the Financial Crisis Cost?” PBS Frontline, April 9, 2012. https://www.pbs.org/wgbh/frontline/article/how-much-did-the-financial-crisis-cost/.
Hecker, Siegfried S. “Why Fukushima Was Preventable.” Carnegie Endowment for International Peace, March 2012. https://carnegieendowment.org/research/2012/03/why-fukushima-was-preventable.
Lowenstein, Roger. When Genius Failed: The Rise and Fall of Long-Term Capital Management. New York: Random House, 2000.
MacKenzie, Donald. An Engine, Not a Camera: How Financial Models Shape Markets. Cambridge, MA: MIT Press, 2006.
National Commission on Terrorist Attacks Upon the United States. The 9/11 Commission Report: Final Report of the National Commission on Terrorist Attacks Upon the United States. New York: W.W. Norton & Company, 2004.
National Diet of Japan. The Official Report of the Fukushima Nuclear Accident Independent Investigation Commission. Tokyo: The Commission, 2012.
Prange, Gordon W. At Dawn We Slept: The Untold Story of Pearl Harbor. New York: Penguin Books, 1981.
U.S. Navy History and Heritage Command. “Pearl Harbor: Why, How, Fleet Salvage and Final Appraisal.” Accessed September 2025. https://www.history.navy.mil/research/library/online-reading-room/title-list-alphabetically/p/pearl-harbor-why-how.html.


Comments