
The Tyranny of the Average: Incentives, Interdependence, and the Failure of the Bell Curve
- Jeff Hulett

- Oct 9, 2025
- 10 min read
Updated: Oct 24, 2025

-- The "Normal" Fallacy: Why the Bell Curve is an Abnormal Distribution.
The bell-shaped curve, or Normal distribution, is arguably the most recognizable image in statistics. Its mathematical ubiquity has led many to believe it is the default, or "normal," state of nature. However, when we apply this distribution to the complex, interdependent realm of human affairs—from wealth and social media engagement to market returns and social influence—the Normal distribution proves to be a statistical anomaly. It is, in fact, an Abnormal Distribution.
About the author: Jeff Hulett leads Personal Finance Reimagined, a decision-making and financial education platform. He teaches personal finance at James Madison University and provides personal finance seminars. Check out his book -- Making Choices, Making Money: Your Guide to Making Confident Financial Decisions.
Jeff is a career banker, data scientist, behavioral economist, and choice architect. Jeff has held banking and consulting leadership roles at Wells Fargo, Citibank, KPMG, and IBM.
The widespread reverence for the Normal distribution is rooted in the Central Limit Theorem (CLT), a concept formalized by Pierre-Simon Laplace and clearly demonstrated by the Galton Board. When a ball falls through the board, it encounters a series of pins, each representing an independent event with a uniform probability of bouncing left or right (a 50/50 chance). This uniform distribution represents a state of aleatory uncertainty—what we can call maximum ignorance about the future outcome of each step. There's simply no way to learn more; the event is truly "learning free," a random future toss where we know the probabilities but cannot know for sure the direction of a single ball. The Normal distribution is the destiny of this system because it is governed by a series of additive and independent random events, all converging to a singular, powerful, central attractor (the statistical equivalent of gravity in the physical world).

Thanks to Pradeep Mutalik and Quanta Magazine for providing this graphical approach for describing the Galton Board.
The Four Moments of Reality
To understand why this model fails in the social world, we can adopt the statistical framework of the Moments of a Distribution. This approach reveals how knowledge builds from simple certainty to complex uncertainty, tracking a continuum moving from the "Science of Certainty" to the "Science of Wonder." This table shows how each step in statistical understanding, called "moments," diverges between the "not so" normal distribution vs. our "abnormal" reality.
Statistical Moment | Concept | What it Measures | Normal Distribution Implication | Social Reality (Abnormal) |
0th Moment | Unity | The sum of all probabilities is one. | The baseline: We know something will happen. We know what will happen relates to the characteristics of a normal distribution. | Our challenge is the unknown sample space—we do not know anything about possible outcomes nor do we know the functional shape guiding the probabilities of those outcomes. |
1st Moment | Expected Value (Mean) | The distribution’s center or average. | A stable, reliable average representing the central attractor. | This "center" is often irrelevant and impacted by multiple attractors. |
2nd Moment | Variance | The dispersion or spread around the mean. | Reveals risk, but assumes spread is symmetric, consistent, and predictable. | The spread is often vast, asymmetrical, and driven by outliers. |
3rd/4th Moments | Skewness & Kurtosis | Asymmetry (skewness) and the weight of the tails (kurtosis). | These are usually small, guaranteeing symmetry and thin tails with few extremes. | These moments are dominant, producing fat tails where extreme events are normal. |
The Fallacy of the Micro-Assumption
The mathematical path to the Normal distribution rests on a critical micro-assumption: the probability of bouncing left or right at each pin is uniform, independent, and represents a state of maximum ignorance about the next step—a form of aleatory risk (inherent, irreducible physical randomness with known probabilities).
Human systems violate all three conditions. They are impacted by a fundamentally different condition: epistemic uncertainty (or uncertainty arising from a lack of knowledge—incomplete data, models, or an unknown sample space). As social creatures, we are decidedly not independent; our decisions are inherently interconnected and influenced by one another. Furthermore, human rationality is a form of distributed intelligence—each participant possesses hidden incentives, constraints, and information (minimal ignorance) guiding their choices. These internal and relational factors eliminate the foundational uniform distribution, guaranteeing the macro-outcome will be asymmetrical and complex, rendering the Normal distribution an improbable edge case.
The "NOT" Galton Board

What if someone knew that following their incentives meant going far to the right is "good" and going to the left is "bad?" This intelligence would create an environment deeply encouraging someone to seek policies and family advantages to go toward the "good." This is an example of Goodhart's Law, to be discussed soon.
Why the Social World Rejects Normality
"The greatest problem in risk management is the sheer inability to imagine the things that have not yet happened."
— Thomas C. Schelling,
Nobel Laureate in Economics (Game Theory)
The normal assumption only works for the world beyond human reach. Unless you are a massive planet, a subatomic particle, or an untouchable chemical, you are impacted by abnormal distributions. The core of the "Normal Fallacy" is the implicit assumption social systems behave as if only 1) the first two statistical moments matter and 2) those two moments are reducible to a simple center and a symmetric, consistent spread (variance). This model fails because social outcomes are overwhelmingly defined by the dominant and complex influence of the third and fourth moments (skewness and kurtosis).
Additive vs. Multiplicative Noise: The Normal distribution is a product of additive noise (the independent, fixed steps of the Galton board). In contrast, human systems are defined by multiplicative noise. Returns on investment compound, social influence spreads exponentially, and skills build upon themselves. When effects multiply, the system naturally generates Log-Normal or Power Law distributions, which are inherently skewed and heavy-tailed.
Ignorance is Unstructured, Social Life is Biased: The Normal distribution starts from an ideal state of uniform ignorance at the micro-level. Yet, our lives are anything but uniform. A person’s socioeconomic background, education, and social network are not 50/50 starting points; they create massive, non-uniform incentives and constraints introducing asymmetry and bias from the very first "pin" in the system. Our starting reality is already tilted, eliminating the possibility of symmetric outcomes. These varying starting points are discussed at the end of the article.
The Interdependent Nature of Metrics (Goodhart's Law): The Normal model assumes independent data points, but social systems are rife with interdependence. This is formalized by Goodhart's Law—"when a measure becomes a target, it ceases to be a good measure." The moment a metric (like test scores, bank capital ratios, or employee performance ratings) is targeted for policy, people adapt their behavior to satisfy the measure rather than the underlying objective. This feedback loop is non-linear and creates unintended consequences, shattering the additive, predictable structure of Normal distribution models.
The Pull of the Outliers (High Skewness and Kurtosis): In social and economic life, the dynamics are governed not by a single central attractor but by forces amplifying success or failure:
Interdependence and Feedback Loops: Unlike the independent events of the Galton Board, social outcomes feature preferential attachment and compounding effects. The rich get richer; the viral post gets more views. These multiplicative processes create skewness (3rd moment), pulling the distribution’s tail far to one side.
Fat Tails (High Kurtosis): The Normal curve predicts extreme outcomes (like a pandemic or a financial crash) are astronomically rare—mathematically impossible in a practical sense. However, social and financial reality demonstrates fat tails (high kurtosis, the 4th moment) are the norm. Extreme events occur far more frequently than the bell curve allows, forcing us to move from the "Science of Certainty" to the "Science of Wonder", where risk and extreme irregularity dominate.
The Behavioral Cost of Normality
"Normality is a myth; there never was, and never will be, a normal distribution."
— R.C. Geary, Statistician and author
The misapplication of the Normal distribution is not merely a statistical error; it is a failure of choice architecture with significant real-world costs. As behavioral economists understand, systems designed for a Normal world fail dramatically in an Abnormal one:
Underestimation of Risk: Relying on the Normal curve leads to complacency, causing us to dismiss Black Swan events (like the 2008 financial crisis) as improbable outliers when they are, in fact, inevitable features of a fat-tailed system.
Underestimation of Return: The model blinds us to the positive power laws. It suggests returns are symmetric around the mean, causing us to overlook the massive, skewed upside potential derived from compound interest in finance or the exponential health gains from consistent, long-term exercise.
Misguided Policy: Policies aimed at raising the average person (the 1st moment) often ignore the power laws driving systemic inequality (the 3rd moment). True social change requires addressing the multiplicative forces creating and sustaining the massive, skewed tail of outcomes.
The Normal distribution represents a beautiful, stable, and mathematically tractable outcome. But precisely because it is so rarely achieved in the social world—a world characterized by the volatile, unpredictable forces of the higher statistical moments—it should be recognized for what it is. When dealing with people and society, the bell curve is not the norm; it is the Abnormal Distribution.
This critique is NOT to suggest statistical determinism. Determinism is the philosophical belief indicating all events, including human choices, are entirely determined by previously existing causes, leaving no room for true free will. Quite the opposite, understanding the abnormal distributions of life is the path to freedom. Returning to the "NOT Galton Board," some people's starting point will be further to the "bad" left or the "good" right. This is just the reality of our diverse world. However, by asserting our agency, we have the OPPORTUNITY for making decisions which help to fall to the "good" right side of the next (future) pin. Nothing is for sure and the future is probabilistic. But the future is our playing field and we should play the probabilities of success. See this article link for our approach to move more to the "good" right, regardless of your starting point.
This analogy uses the "NOT Galton Board" to model life's probabilistic nature, where a decision-making framework is necessary to actively play the odds. The terms "good" and "bad" are used to signal subjective, diverse, and moving value judgments, recognizing a person's starting point and definition of "success" is highly individualized and changes over time. By rejecting statistical determinism and asserting agency, individuals leverage a structured decision-making process to increase the probabilities of success toward their personal "good."
Recognizing the true rules of the game—the inevitable and unpredictable skewness and fat tails—is the first step toward reclaiming and optimizing your agency. By understanding these non-linear incentives and forces, we gain the knowledge needed to design better choices and strategies. This awareness actively empowers and optimizes our free will.
Choice matters GREATLY.
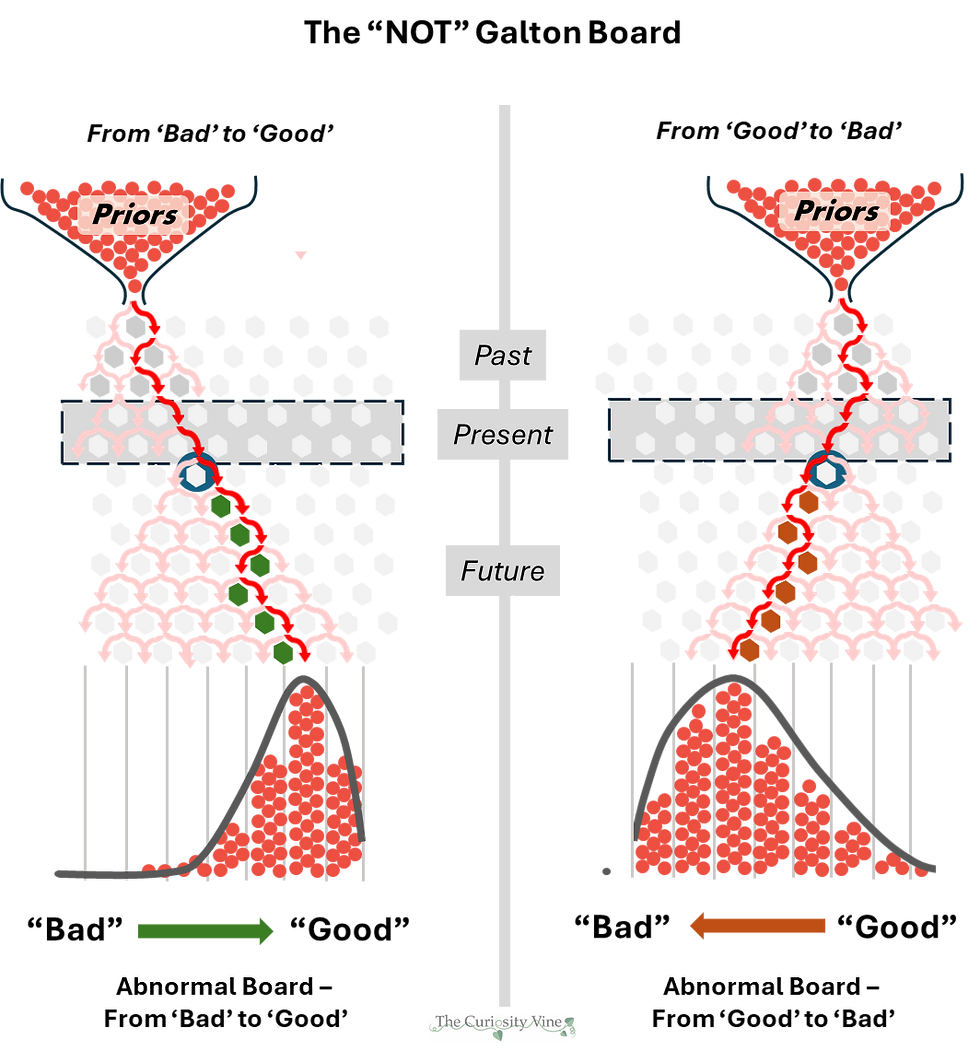
The two "Not Galton Board" examples illustrate this: the starting position—the "priors"—is set by the past (family support, wealth, etc.). The dotted-lined box in these NOT Galton boards represents the present. It is the essential gateway between the observed path of the past and the probabilistic future. The path through the pins represents decision points. Better decisions at these pins lead to higher probabilities for "good" outcomes, allowing one to overcome "bad" priors (left board) or squander "good" ones (right board). The past holds knowledge, the future contains opportunity, and the present provides maximum decision agency.
Learn from the past — Achieve future opportunities — Decide today
Resources for the Curious
Works by Jeff Hulett
Hulett, Jeff. "When Maps Melt." The Curiosity Vine, 2025.
Explores epistemic uncertainty by demonstrating how all human affairs are constrained by the 3 Nevers (Knowledge is Never Complete, Never Static, and Never Centralized), necessitating a decision framework that accepts the inherent limits to measurable knowledge and avoids the flawed practice of extrapolating solely from historical frequency.
Hulett, Jeff. “Win The Data War: How normal people can survive and thrive in the data abundance era.” The Curiosity Vine. 2023. Provides the foundational statistical moments framework, moving from certainty to wonder, used to critique the assumed normality of social distributions in this article.
Hulett, Jeff. Making Choices, Making Money: Your Guide to Making Confident Financial Decisions. Personal Finance Reimagined Press, 2023. Explores the role of choice architecture and personal algorithms in countering the systemic biases leading to non-normal outcomes.
Hulett, Jeff. “The Missouri Fallacy: When the ‘show-me’ approach leads to disaster.” The Curiosity Vine. 2024. Examines the cognitive biases inherent in using small, unrepresentative samples, connecting to the unreliability of the mean in skewed distributions.
Foundational and Scholarly Critique
Mutalik, Pradeep. “Solution: Randomness From Determinism.” Quanta Magazine, November 22, 2019.
Illustrates the principle of how randomness emerges from deterministic systems using the striking visual of the Galton Board, which aids in distinguishing statistical ideals, like the normal distribution, from the more complex reality of day-to-day phenomena.
Taleb, Nassim Nicholas. The Black Swan: The Impact of the Highly Improbable. Random House, 2007. The seminal work on fat tails and Black Swan events, arguing the Normal distribution dangerously underestimates the frequency and impact of rare extremes in financial and social systems.
Gabaix, Xavier. "Power Laws in Economics and Finance." Annual Review of Economics, Vol. 1, 2009, pp. 255-294. Provides a scholarly survey of empirical evidence showing wealth, city sizes, and stock returns follow Power Laws—the statistical embodiment of "abnormal" distribution—rather than the Normal distribution.
Gould, Stephen Jay. The Mismeasure of Man. W. W. Norton & Company, 1981. A classic critique of the historical misuse of the bell curve to categorize and rank human intelligence and other complex traits, arguing against the naturalization of the Normal distribution in social contexts.
Geary, R. C. “The Central Limit Theorem and the Normality of Regression Residuals.” Biometrika, 1947, pp. 240-244. Contains the often-quoted sentiment "Normality is a myth; there never was, and never will be, a normal distribution" in reality.
Thaler, Richard H., and Cass R. Sunstein. Nudge: Improving Decisions About Health, Wealth, and Happiness. Yale University Press, 2008. Explains choice architecture—the environmental forces influencing non-uniform human decisions—highlighting why social outcomes are not the result of independent 50/50 choices.
Azzalini, Adelchi. “A Class of Distributions Which Includes the Normal.” Scandinavian Journal of Statistics, Vol. 12, 1985, pp. 171-178. Introduces the Skew-Normal distribution, acknowledging even when unimodal, real-world data frequently exhibits skewness (the 3rd moment), showing the limitations of the symmetric Normal curve.
Limpert, E., W. A. Stahel, and M. Abbt. “Problems with Using the Normal Distribution – and Ways to Improve Quality and Efficiency of Data Analysis.” PLoS Biology, Vol. 3, No. 7, 2005. Argues multiplicative causes are more prevalent than additive ones in natural and social science, making the Lognormal distribution—a skewed alternative—a more appropriate fit for much of reality.
The article asserts, "....human rationality is a form of distributed intelligence—each participant possesses hidden incentives, constraints, and information."
However, the traditional economic model assumes "robo-rationality", where all agents follow a linear path to a single, optimal decision, a view failing when applied to the social world. This assumption of uniform behavior breaks down because human rationality is diverse, being deeply personal, dynamic, and shaped by individual constraints, incentives, and evolving life circumstances. Moral philosophers and economists like Adam Smith, Herbert Simon (Bounded Rationality), F.A. Hayek, and Thomas Sowell all recognized this complexity, arguing knowledge is dispersed and decisions are based on local, subjective value. This diverse rationality demonstrates people possess minimal ignorance (as necessary for the uniform distribution) and are not independent actors. This directly invalidates the core assumptions (uniformity and independence) of the Normal distribution. For more information, see: Hulett, Jeff. "Rethinking Rationality: The Hidden Diversity in Our Choices." The Curiosity Vine, 2025.


Comments