
Treasury Rates Update: January 11th, 2024
- Bill Knudson
- Jan 12, 2024
- 2 min read
Updated: Feb 23, 2024
Summary: On 12.13.23 the Fed kept rates unchanged however they clearly indicated that up to 3 rate cuts were a distinct possibility in 2024. After that announcement, two senior Fed members indicated that rate reductions could be made later in the year pending economic data. Since then rates have gone flat line. 10-year US Treasuries down 1bp this past week, up 6bp for the prior 2 weeks.
Upcoming Key Economic Data Releases:
1.5.24 New jobs data for December released 216,000 Not too hot, not too cold.
•
1.11.24 CPI data for December was released monthly at 0.3% which replaced Dec 2022 month's 0.1%. Larger numbers replaced smaller ones, this caused the annual CPI to increase from 3.1% to 3.3%
•
1.31.24 Fed Meeting
For the past 2 weeks, 10-year Treasury rates were up 19bp. Past week down 1bp.

The red line is the most current rate while the green line is from one week ago.
Longer-term rates decreased less relative to shorter-term rates, as such the inverted yield curve is less steep. For terms 5+ years, the Yield Curve is positive. One-month rates were down 1bp.

The10 10-year US Treasury rate is a vital rate to keep track of. It is used as a benchmark spread for home mortgage rate setting. It is also used for Commercial Real Estate valuation determination.
Below is the daily rates for 2023. Starts off the year at 3.79% and reaches it low of 3.30% on April 5 then rockets up to 4.98% on Oct 19 and then plummets to 3.88% on Dec 31. That is a 22% drop from the high to the year-end. This is huge. Any firm holding this instrument benefited from higher values as well as CRE.
The beginning and year-end values are about equal and both are close to the year’s average of 3.96%. 2023 was a wild ride in rates and hence values.

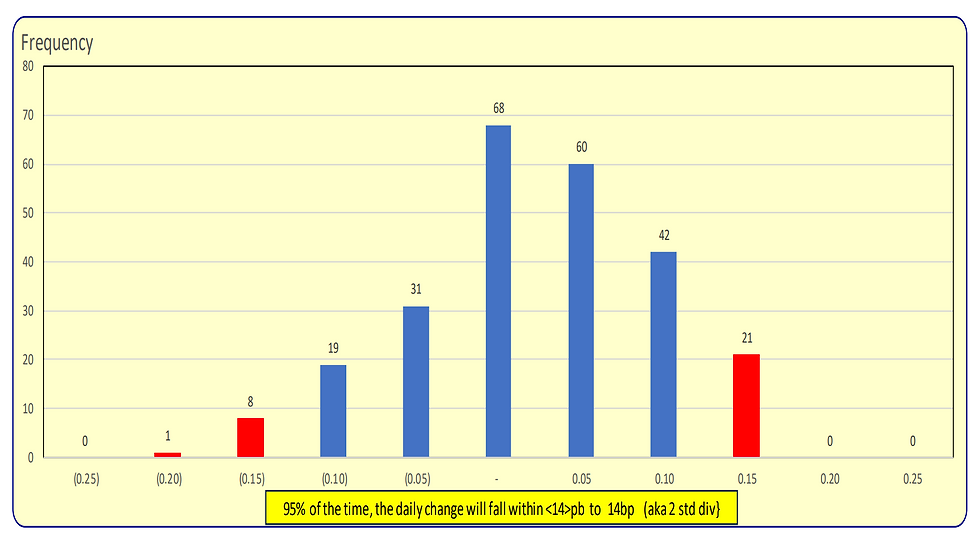
Daily changes are shown below. It is noted that there were more rate decreases of <15bp> than there rate increases of 15bp. Surprisingly larger daily decreases than increases of similar magnitudes.

95% of the daily changes were in the blue bars, both increases and decreases. This is 2 standard deviations.
The key takeaway is when a 15bp change occurs, it is a 2 sigma event (i.e. very unusual) based on 2023 rates.


Comments